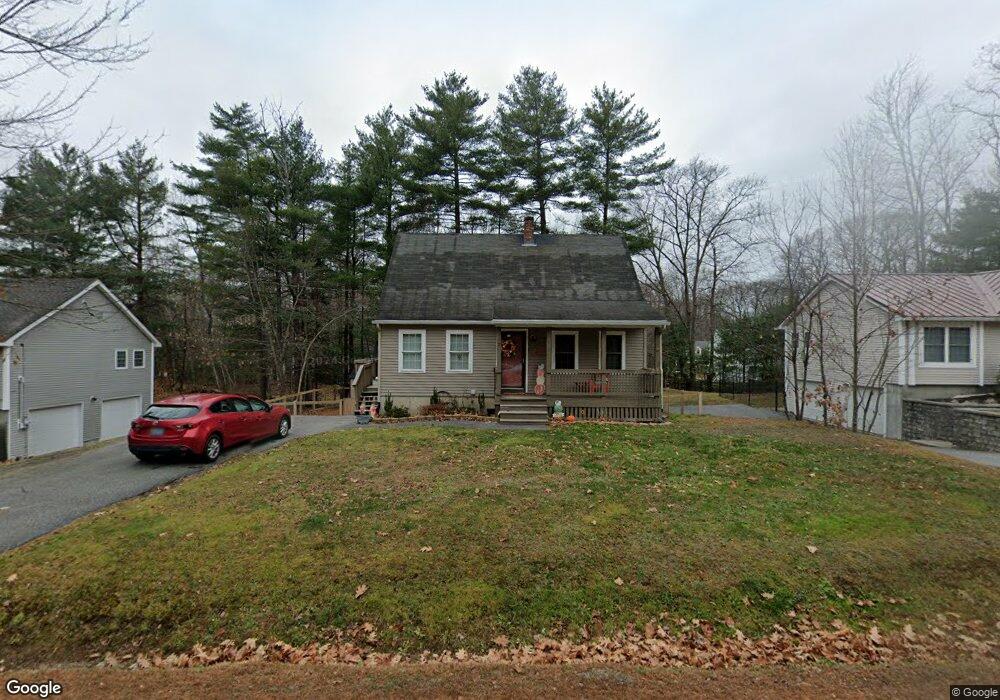
7 Poplar St Unit 892408 Old Orchard Beach, ME 04064
Estimated Value: $503,000 - $525,000
3
Beds
2
Baths
1,344
Sq Ft
$381/Sq Ft
Est. Value
About This Home
This home is located at 7 Poplar St Unit 892408, Old Orchard Beach, ME 04064 and is currently estimated at $512,686, approximately $381 per square foot. 7 Poplar St Unit 892408 is a home located in York County with nearby schools including Jameson Elementary School, Loranger Memorial School, and Old Orchard Beach High School.
Ownership History
Date
Name
Owned For
Owner Type
Purchase Details
Closed on
Dec 21, 2020
Sold by
Pratt Daniel L and Pratt Theresa A
Bought by
Mohan Stephanie and Mohan John
Current Estimated Value
Home Financials for this Owner
Home Financials are based on the most recent Mortgage that was taken out on this home.
Original Mortgage
$268,000
Outstanding Balance
$239,025
Interest Rate
2.8%
Mortgage Type
New Conventional
Estimated Equity
$273,661
Create a Home Valuation Report for This Property
The Home Valuation Report is an in-depth analysis detailing your home's value as well as a comparison with similar homes in the area
Home Values in the Area
Average Home Value in this Area
Purchase History
| Date | Buyer | Sale Price | Title Company |
|---|---|---|---|
| Mohan Stephanie | -- | None Available |
Source: Public Records
Mortgage History
| Date | Status | Borrower | Loan Amount |
|---|---|---|---|
| Open | Mohan Stephanie | $268,000 |
Source: Public Records
Tax History Compared to Growth
Tax History
| Year | Tax Paid | Tax Assessment Tax Assessment Total Assessment is a certain percentage of the fair market value that is determined by local assessors to be the total taxable value of land and additions on the property. | Land | Improvement |
|---|---|---|---|---|
| 2024 | $4,139 | $380,400 | $139,300 | $241,100 |
| 2023 | $3,997 | $350,600 | $129,100 | $221,500 |
| 2022 | $3,956 | $323,200 | $117,400 | $205,800 |
| 2021 | $4,002 | $282,600 | $106,200 | $176,400 |
| 2020 | $2,853 | $210,000 | $60,500 | $149,500 |
| 2019 | $3,255 | $210,000 | $60,500 | $149,500 |
| 2018 | $2,676 | $208,600 | $60,500 | $148,100 |
| 2017 | $2,878 | $183,300 | $49,900 | $133,400 |
| 2016 | $2,851 | $184,400 | $48,500 | $135,900 |
| 2015 | $2,799 | $184,400 | $48,500 | $135,900 |
| 2014 | $2,744 | $184,400 | $48,500 | $135,900 |
| 2013 | $2,585 | $187,300 | $51,400 | $135,900 |
Source: Public Records
Map
Nearby Homes
- 2 Poplar St
- Lot 3-5 Juniper St
- 404-3-3 Juniper St
- 4 Bogey Way
- 3 Bogey Way
- 9 Bouchard Ct
- 50 Pheasant Rd
- 83 Wild Dunes Way
- 58 Pheasant Rd
- 49 Pheasant Rd
- 26 Wild Dunes Way
- 22 A Meserve Cir
- 28 Pine Haven St
- 4 Mickelson Way
- 10 Dode Rd
- 52 Wild Dunes Way Unit 13B
- 6 Pheasant Rd
- 11 Clayton Dr
- 5 Magnolia Dr
- 15 Magnolia Dr