T
Seller's Agent in 2015
Thomas OHearn
Cranberry Real Estate
(508) 737-1776
12 in this area
22 Total Sales


Estimated Value: $1,576,000 - $1,759,528
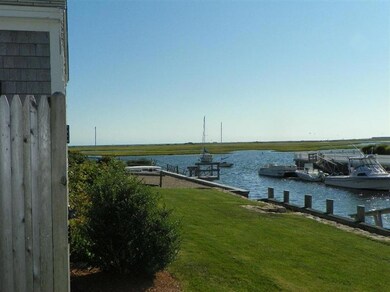
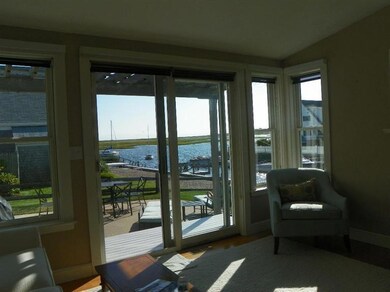
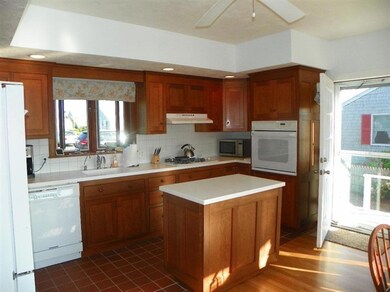
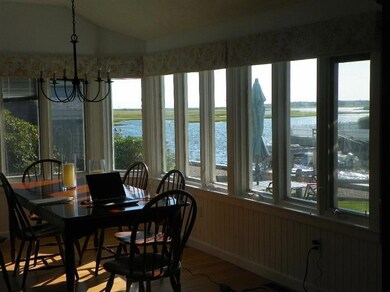
Fabulous Waterfront Home on the Fingers of West Dennis with private dock. Impeccable condition. Home features three bedrooms, two full baths, open space living room with fireplace, modern kitchen with all appliances, vaulted ceiling overlooking a million dollar waterview. Additional family room with sliders to deck. All hardwood flooring, gas heat, central a/c, 1st floor laundry, reinforced bulkhead with private dock just a step out your back door with easy ocean access. This home makes the list of top waterfront homes in West Dennis. Very short walk to West Dennis beach. Summer Rental Income $3,200 per week, don't miss the waterfront opportunity to own in the seaside village of West Dennis.
Last Agent to Sell the Property
Cranberry Real Estate License #80821-B Listed on: 08/26/2014
| Date | Buyer | Sale Price | Title Company |
|---|---|---|---|
| Mar Crs Lt | $917,000 | -- | |
| Westward Properties Ll | -- | -- | |
| Faucher Michael | $815,000 | -- | |
| Carlin Andrea L | $988,000 | -- | |
| Carlin Andrea L | $988,000 | -- |
| Date | Status | Borrower | Loan Amount |
|---|---|---|---|
| Open | Mar Crs Lt | $250,000 | |
| Previous Owner | Carlin Andrea L | $682,000 | |
| Previous Owner | Carlin Andrea L | $700,000 |
| Date | Event | Price | List to Sale | Price per Sq Ft |
|---|---|---|---|---|
| 08/28/2015 08/28/15 | Sold | $815,000 | -9.4% | $533 / Sq Ft |
| 08/13/2015 08/13/15 | Pending | -- | -- | -- |
| 08/26/2014 08/26/14 | For Sale | $899,900 | -- | $589 / Sq Ft |
| Year | Tax Paid | Tax Assessment Tax Assessment Total Assessment is a certain percentage of the fair market value that is determined by local assessors to be the total taxable value of land and additions on the property. | Land | Improvement |
|---|---|---|---|---|
| 2025 | $6,417 | $1,482,000 | $1,011,100 | $470,900 |
| 2024 | $6,250 | $1,423,700 | $972,300 | $451,400 |
| 2023 | $6,046 | $1,294,700 | $883,900 | $410,800 |
| 2022 | $4,754 | $848,900 | $546,000 | $302,900 |
| 2021 | $4,764 | $790,000 | $535,300 | $254,700 |
| 2020 | $4,913 | $805,400 | $535,300 | $270,100 |
| 2019 | $4,656 | $754,700 | $524,800 | $229,900 |
| 2018 | $4,956 | $781,700 | $572,400 | $209,300 |
| 2017 | $4,639 | $754,300 | $551,600 | $202,700 |
| 2016 | $5,069 | $776,200 | $598,500 | $177,700 |
| 2015 | $4,954 | $774,100 | $598,500 | $175,600 |
| 2014 | $4,916 | $774,100 | $598,500 | $175,600 |
T
Seller's Agent in 2015
Thomas OHearn
Cranberry Real Estate
(508) 737-1776
12 in this area
22 Total Sales
Source: Cape Cod & Islands Association of REALTORS®
MLS Number: 21408039
APN: DENN-000027-000000-000159
Disclaimer: Certain information contained herein is derived from information provided by parties other than Homes.com. All information provided is deemed reliable, but is not guaranteed to be accurate and should be independently verified.
![]() All data relating to real estate for sale on this page comes from the Broker Reciprocity (BR) of the Cape Cod & Islands Multiple Listing Service, Inc. Detailed information about real estate listings held by brokerage firms other than CC&I Assoc. of REALTORS®, Inc. includes the name of the listing company. Neither the listing company nor CC&I Assoc. of REALTORS®, Inc. shall be responsible for any typographical errors, misinformation, misprints and shall be held totally harmless. The Broker providing this data believes it to be correct, but advises interested parties to confirm any item before relying on it in a purchase decision. All properties are subject to prior sale, changes, or withdrawal. Copyright 2025 © Cape Cod & Islands Multiple Listing Service, Inc. All rights reserved.
All data relating to real estate for sale on this page comes from the Broker Reciprocity (BR) of the Cape Cod & Islands Multiple Listing Service, Inc. Detailed information about real estate listings held by brokerage firms other than CC&I Assoc. of REALTORS®, Inc. includes the name of the listing company. Neither the listing company nor CC&I Assoc. of REALTORS®, Inc. shall be responsible for any typographical errors, misinformation, misprints and shall be held totally harmless. The Broker providing this data believes it to be correct, but advises interested parties to confirm any item before relying on it in a purchase decision. All properties are subject to prior sale, changes, or withdrawal. Copyright 2025 © Cape Cod & Islands Multiple Listing Service, Inc. All rights reserved.
