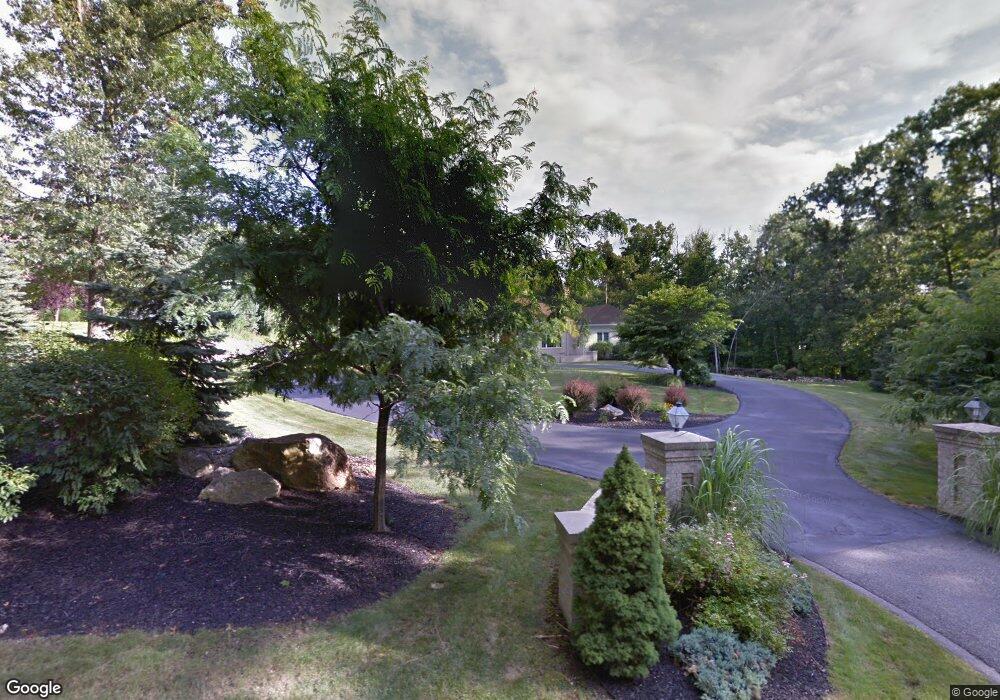
7 Powers Dr Wilbraham, MA 01095
Estimated Value: $893,176 - $1,402,000
4
Beds
3
Baths
3,712
Sq Ft
$299/Sq Ft
Est. Value
About This Home
This home is located at 7 Powers Dr, Wilbraham, MA 01095 and is currently estimated at $1,108,725, approximately $298 per square foot. 7 Powers Dr is a home located in Hampden County with nearby schools including Minnechaug Regional High School and Wilbraham & Monson Academy.
Ownership History
Date
Name
Owned For
Owner Type
Purchase Details
Closed on
Aug 19, 2011
Sold by
Oberg Gail A
Bought by
Mcgovern Stephen C and Mcgovren Mary C
Current Estimated Value
Home Financials for this Owner
Home Financials are based on the most recent Mortgage that was taken out on this home.
Original Mortgage
$325,000
Outstanding Balance
$93,649
Interest Rate
4.62%
Mortgage Type
Purchase Money Mortgage
Estimated Equity
$1,015,076
Purchase Details
Closed on
Mar 2, 2004
Sold by
Oberg Ft and Oberg Gail A
Bought by
Oberg Gail A
Purchase Details
Closed on
Oct 5, 1998
Sold by
Duncan-Earle Janet P
Bought by
Oberg Ft and Oberg Ronald C
Home Financials for this Owner
Home Financials are based on the most recent Mortgage that was taken out on this home.
Original Mortgage
$350,000
Interest Rate
6.89%
Mortgage Type
Purchase Money Mortgage
Create a Home Valuation Report for This Property
The Home Valuation Report is an in-depth analysis detailing your home's value as well as a comparison with similar homes in the area
Home Values in the Area
Average Home Value in this Area
Purchase History
| Date | Buyer | Sale Price | Title Company |
|---|---|---|---|
| Mcgovern Stephen C | $650,000 | -- | |
| Oberg Gail A | -- | -- | |
| Oberg Ft | $500,000 | -- |
Source: Public Records
Mortgage History
| Date | Status | Borrower | Loan Amount |
|---|---|---|---|
| Open | Mcgovern Stephen C | $325,000 | |
| Previous Owner | Oberg Ft | $350,000 |
Source: Public Records
Tax History
| Year | Tax Paid | Tax Assessment Tax Assessment Total Assessment is a certain percentage of the fair market value that is determined by local assessors to be the total taxable value of land and additions on the property. | Land | Improvement |
|---|---|---|---|---|
| 2025 | $16,459 | $920,500 | $174,300 | $746,200 |
| 2024 | $15,633 | $845,000 | $168,300 | $676,700 |
| 2023 | $14,488 | $793,200 | $174,300 | $618,900 |
| 2022 | $14,488 | $707,100 | $151,700 | $555,400 |
| 2021 | $15,576 | $678,400 | $156,900 | $521,500 |
| 2020 | $15,183 | $678,400 | $156,900 | $521,500 |
| 2019 | $14,538 | $666,900 | $156,900 | $510,000 |
| 2018 | $13,315 | $588,100 | $156,900 | $431,200 |
| 2017 | $12,938 | $588,100 | $156,900 | $431,200 |
| 2016 | $12,416 | $574,800 | $161,700 | $413,100 |
| 2015 | $12,002 | $574,800 | $161,700 | $413,100 |
Source: Public Records
Map
Nearby Homes
- 230V Burleigh Rd
- 24 Mcintosh Dr
- 6 Katie St
- 85 Baldwin Dr
- 107 Baldwin Dr
- 1070 Glendale Rd
- 0 Mountain Rd Unit 73267162
- 0 Mountain Rd Unit 72942534
- 75 North Rd
- 6 Hilltop Park
- 733 Monson Rd
- 8 Patriot Ridge Ln
- 745 Glendale Rd
- 5 Edgewood Rd
- 325 Allen St
- 474 Mountain Rd
- 20 Old Orchard Rd
- 46 Holland Dr
- 140 Slumber Ln
- 16 Deerfoot Dr
Your Personal Tour Guide
Ask me questions while you tour the home.