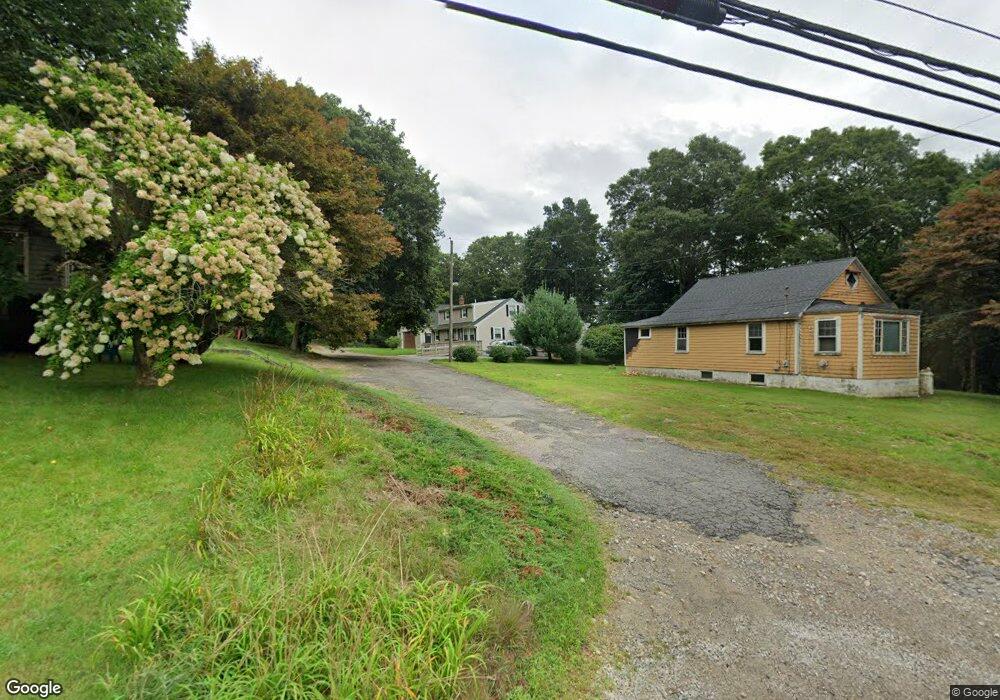
7 Proulx St Westport, MA 02790
North Westport NeighborhoodEstimated Value: $476,000 - $572,856
4
Beds
--
Bath
2,472
Sq Ft
$211/Sq Ft
Est. Value
About This Home
This home is located at 7 Proulx St, Westport, MA 02790 and is currently estimated at $522,214, approximately $211 per square foot. 7 Proulx St is a home located in Bristol County with nearby schools including Alice A. Macomber Primary School, Westport Elementary School, and Westport Middle-High School.
Ownership History
Date
Name
Owned For
Owner Type
Purchase Details
Closed on
Jul 26, 2019
Sold by
Reiff Nancy M and Orr Michael R
Bought by
Stlaurent Donna L and Stlaurent Richard
Current Estimated Value
Purchase Details
Closed on
May 26, 2016
Sold by
Orr Aida
Bought by
Orr Aida and Reiff Nancy M
Purchase Details
Closed on
Jun 30, 2015
Sold by
Orr Raymond and Orr Aida
Bought by
Orr Aida
Create a Home Valuation Report for This Property
The Home Valuation Report is an in-depth analysis detailing your home's value as well as a comparison with similar homes in the area
Home Values in the Area
Average Home Value in this Area
Purchase History
| Date | Buyer | Sale Price | Title Company |
|---|---|---|---|
| Stlaurent Donna L | $260,000 | -- | |
| Orr Aida | -- | -- | |
| Orr Aida | -- | -- |
Source: Public Records
Tax History
| Year | Tax Paid | Tax Assessment Tax Assessment Total Assessment is a certain percentage of the fair market value that is determined by local assessors to be the total taxable value of land and additions on the property. | Land | Improvement |
|---|---|---|---|---|
| 2025 | $3,855 | $517,400 | $144,300 | $373,100 |
| 2024 | $3,859 | $499,200 | $133,700 | $365,500 |
| 2023 | $3,869 | $474,200 | $121,200 | $353,000 |
| 2022 | $3,498 | $416,300 | $115,200 | $301,100 |
| 2021 | $3,498 | $405,800 | $104,700 | $301,100 |
| 2020 | $2,350 | $278,800 | $95,200 | $183,600 |
| 2019 | $2,267 | $274,100 | $95,200 | $178,900 |
| 2018 | $1,989 | $243,500 | $106,300 | $137,200 |
| 2017 | $1,930 | $242,200 | $102,900 | $139,300 |
| 2016 | $1,890 | $238,900 | $99,600 | $139,300 |
| 2015 | $1,871 | $235,900 | $101,800 | $134,100 |
Source: Public Records
Map
Nearby Homes
- 116 Gifford Rd
- 13 3rd Ave
- 0 Hertitage Acres
- 16 Lenox Ave
- 100 D Dr
- 15 S Breault St
- 2 Van Buren St
- 3 Diane Way
- 358 Briggs Rd
- 565 Highland Ave
- 300 Davis Rd
- 343 Old Bedford Rd
- 11 Harrison Ct
- 1276 Old Fall River Rd
- 320-322 Old Bedford Rd
- 0 American Legion Hwy Unit 73473517
- 2 Fieldstone Dr
- 6 Beaulieu St
- 25 Beaulieu St
- 85 Watuppa Rd
Your Personal Tour Guide
Ask me questions while you tour the home.