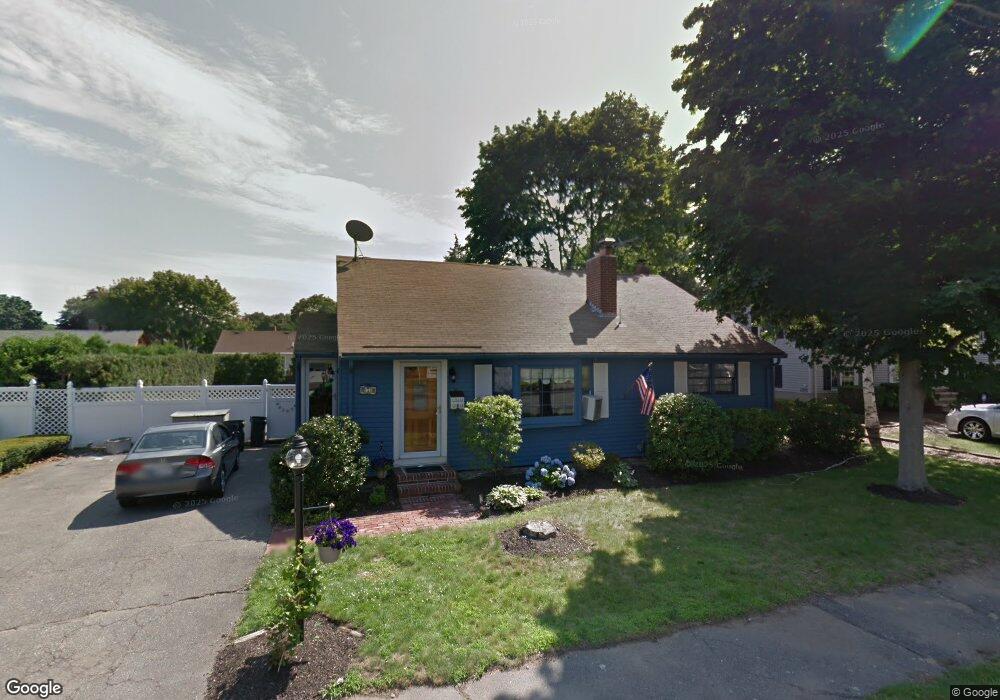
7 Ray St Danvers, MA 01923
Estimated Value: $758,414 - $828,000
4
Beds
4
Baths
2,400
Sq Ft
$334/Sq Ft
Est. Value
About This Home
This home is located at 7 Ray St, Danvers, MA 01923 and is currently estimated at $801,354, approximately $333 per square foot. 7 Ray St is a home located in Essex County with nearby schools including Danvers High School and St. Mary of the Annunciation School.
Ownership History
Date
Name
Owned For
Owner Type
Purchase Details
Closed on
Aug 9, 2023
Sold by
Hurley Brian G and Hurley Maura A
Bought by
Hurley Maura A
Current Estimated Value
Purchase Details
Closed on
Apr 19, 2005
Sold by
Hurley Maura A
Bought by
Hurley Brian G
Purchase Details
Closed on
Apr 16, 2004
Sold by
Hurley Maura and Perry Walter A
Bought by
Hurley Maura A
Purchase Details
Closed on
Sep 30, 1999
Sold by
Morneau Ronald A and Morneau Andrea J
Bought by
Perry Walter A
Create a Home Valuation Report for This Property
The Home Valuation Report is an in-depth analysis detailing your home's value as well as a comparison with similar homes in the area
Home Values in the Area
Average Home Value in this Area
Purchase History
| Date | Buyer | Sale Price | Title Company |
|---|---|---|---|
| Hurley Maura A | -- | None Available | |
| Hurley Brian G | -- | -- | |
| Hurley Maura A | -- | -- | |
| Perry Walter A | $279,000 | -- |
Source: Public Records
Mortgage History
| Date | Status | Borrower | Loan Amount |
|---|---|---|---|
| Previous Owner | Perry Walter A | $346,320 |
Source: Public Records
Tax History
| Year | Tax Paid | Tax Assessment Tax Assessment Total Assessment is a certain percentage of the fair market value that is determined by local assessors to be the total taxable value of land and additions on the property. | Land | Improvement |
|---|---|---|---|---|
| 2025 | $6,908 | $628,600 | $333,500 | $295,100 |
| 2024 | $6,889 | $620,100 | $333,500 | $286,600 |
| 2023 | $6,448 | $548,800 | $303,000 | $245,800 |
| 2022 | $6,468 | $510,900 | $275,000 | $235,900 |
| 2021 | $6,230 | $466,700 | $260,400 | $206,300 |
| 2020 | $6,056 | $463,700 | $257,400 | $206,300 |
| 2019 | $5,805 | $437,100 | $234,000 | $203,100 |
| 2018 | $5,645 | $416,900 | $231,700 | $185,200 |
| 2017 | $5,360 | $377,700 | $202,400 | $175,300 |
| 2016 | $5,162 | $363,500 | $193,100 | $170,400 |
| 2015 | $5,040 | $338,000 | $175,500 | $162,500 |
Source: Public Records
Map
Nearby Homes
- 11 Andover St
- 97 Sylvan St Unit 7
- 22 Collins St Unit 31
- 63 Adams St
- 10 Clark St
- 152 Endicott St
- 14 Williams St Unit C17
- 9 Ledgewood Way Unit 6
- 108 Abington Rd Unit 108
- 8 Ledgewood Way Unit 20
- 5 Holten St
- 43 Hobart St Unit B
- 3 Ledgewood Way Unit 8
- 500 Northshore Rd Unit 6B
- 102 Centre St
- 6 Venice St Unit B3
- 4 Price Rd
- 35 High St Unit 3D
- 17 Bourbon St Unit 76
- 22 Maple Ave
Your Personal Tour Guide
Ask me questions while you tour the home.