7 Reed St Springvale, ME 04083
Estimated Value: $225,000 - $287,158
2
Beds
2
Baths
1,125
Sq Ft
$230/Sq Ft
Est. Value
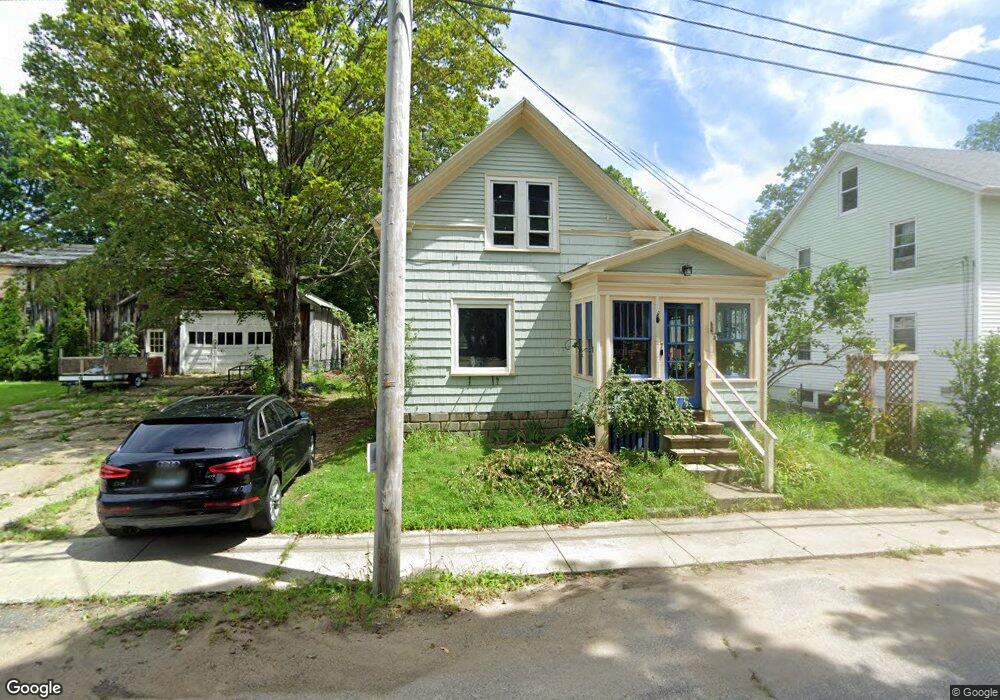
About This Home
This home is located at 7 Reed St, Springvale, ME 04083 and is currently estimated at $258,290, approximately $229 per square foot. 7 Reed St is a home located in York County with nearby schools including St Thomas Consolidated School and Sanford Christian Academy.
Ownership History
Date
Name
Owned For
Owner Type
Purchase Details
Closed on
Sep 30, 2016
Sold by
Mangan Alexandra M
Bought by
Gagnon Amanda
Current Estimated Value
Home Financials for this Owner
Home Financials are based on the most recent Mortgage that was taken out on this home.
Original Mortgage
$119,280
Interest Rate
3.43%
Mortgage Type
New Conventional
Purchase Details
Closed on
Mar 31, 2005
Sold by
Greene Nicholette R
Bought by
Forget Ronald S
Home Financials for this Owner
Home Financials are based on the most recent Mortgage that was taken out on this home.
Original Mortgage
$103,904
Interest Rate
6%
Mortgage Type
Adjustable Rate Mortgage/ARM
Create a Home Valuation Report for This Property
The Home Valuation Report is an in-depth analysis detailing your home's value as well as a comparison with similar homes in the area
Home Values in the Area
Average Home Value in this Area
Purchase History
| Date | Buyer | Sale Price | Title Company |
|---|---|---|---|
| Gagnon Amanda | -- | -- | |
| Forget Ronald S | -- | -- | |
| Forget Ronald S | -- | -- |
Source: Public Records
Mortgage History
| Date | Status | Borrower | Loan Amount |
|---|---|---|---|
| Closed | Gagnon Amanda | $119,280 | |
| Closed | Forget Ronald S | $103,904 |
Source: Public Records
Tax History Compared to Growth
Tax History
| Year | Tax Paid | Tax Assessment Tax Assessment Total Assessment is a certain percentage of the fair market value that is determined by local assessors to be the total taxable value of land and additions on the property. | Land | Improvement |
|---|---|---|---|---|
| 2025 | $3,025 | $176,900 | $30,400 | $146,500 |
| 2024 | $2,855 | $176,900 | $30,400 | $146,500 |
| 2023 | $2,657 | $175,500 | $30,400 | $145,100 |
| 2022 | $2,597 | $175,500 | $30,400 | $145,100 |
| 2021 | $2,540 | $139,700 | $30,400 | $109,300 |
| 2020 | $2,562 | $127,100 | $30,400 | $96,700 |
| 2019 | $2,335 | $112,800 | $30,400 | $82,400 |
| 2018 | $2,239 | $109,200 | $30,400 | $78,800 |
| 2017 | $2,153 | $103,800 | $30,400 | $73,400 |
| 2016 | $2,240 | $98,500 | $30,400 | $68,100 |
| 2015 | $1,871 | $94,900 | $30,400 | $64,500 |
| 2014 | $1,836 | $94,900 | $30,400 | $64,500 |
| 2013 | -- | $94,900 | $30,400 | $64,500 |
Source: Public Records
Map
Nearby Homes