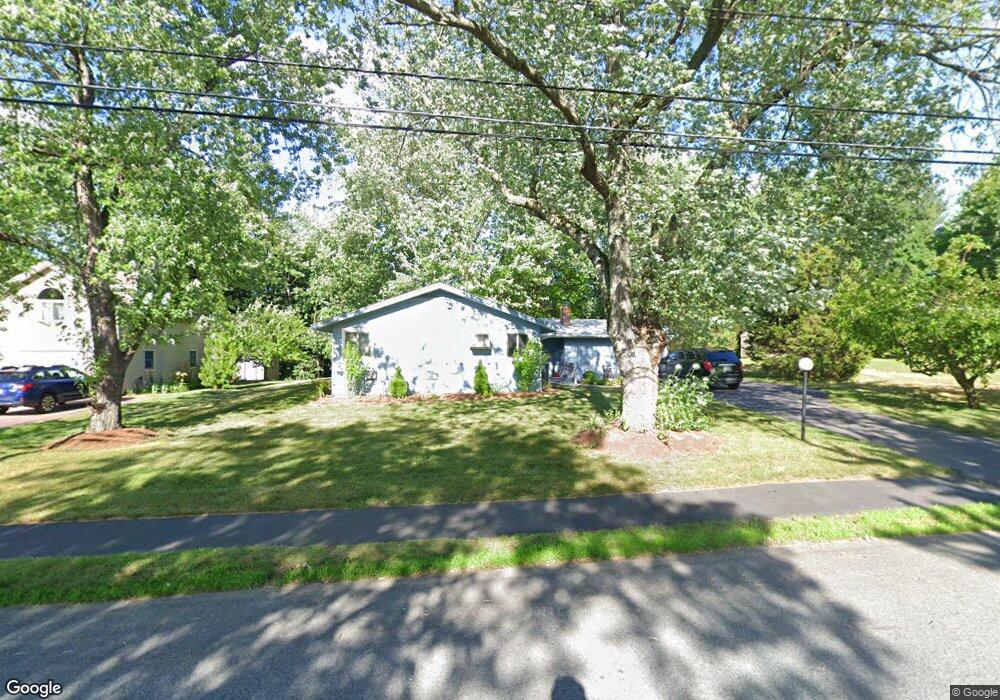
7 Richard Rd Unit 7A Natick, MA 01760
Estimated Value: $654,000 - $745,000
3
Beds
3
Baths
1,800
Sq Ft
$393/Sq Ft
Est. Value
About This Home
This home is located at 7 Richard Rd Unit 7A, Natick, MA 01760 and is currently estimated at $707,301, approximately $392 per square foot. 7 Richard Rd Unit 7A is a home located in Middlesex County with nearby schools including Natick High School, Bennett-Hemenway (Ben-Hem) Elementary School, and Wilson Middle School.
Ownership History
Date
Name
Owned For
Owner Type
Purchase Details
Closed on
Sep 2, 2021
Sold by
Kaldeck Lawrence Est
Bought by
Kaldeck Steven
Current Estimated Value
Home Financials for this Owner
Home Financials are based on the most recent Mortgage that was taken out on this home.
Original Mortgage
$100,000
Interest Rate
3.05%
Mortgage Type
Purchase Money Mortgage
Purchase Details
Closed on
Jun 19, 2019
Sold by
Kaldeck Steven A
Bought by
Kaldeck Lawrence J and Kaldeck Linda A
Home Financials for this Owner
Home Financials are based on the most recent Mortgage that was taken out on this home.
Original Mortgage
$750,000
Interest Rate
4%
Mortgage Type
Adjustable Rate Mortgage/ARM
Purchase Details
Closed on
Apr 5, 2018
Sold by
Kaldeck Lawrence J and Kaldeck Linda A
Bought by
Kaldeck Steven A and Kaldeck Lawrence J
Purchase Details
Closed on
Sep 1, 1977
Bought by
Kaldeck Lawrence J and Kaldeck Linda A
Create a Home Valuation Report for This Property
The Home Valuation Report is an in-depth analysis detailing your home's value as well as a comparison with similar homes in the area
Home Values in the Area
Average Home Value in this Area
Purchase History
| Date | Buyer | Sale Price | Title Company |
|---|---|---|---|
| Kaldeck Steven | $500,000 | None Available | |
| Kaldeck Lawrence J | -- | -- | |
| Kaldeck Steven A | -- | -- | |
| Kaldeck Lawrence J | -- | -- |
Source: Public Records
Mortgage History
| Date | Status | Borrower | Loan Amount |
|---|---|---|---|
| Previous Owner | Kaldeck Steven | $100,000 | |
| Previous Owner | Kaldeck Lawrence J | $750,000 |
Source: Public Records
Tax History Compared to Growth
Tax History
| Year | Tax Paid | Tax Assessment Tax Assessment Total Assessment is a certain percentage of the fair market value that is determined by local assessors to be the total taxable value of land and additions on the property. | Land | Improvement |
|---|---|---|---|---|
| 2025 | $7,292 | $609,700 | $461,300 | $148,400 |
| 2024 | $7,089 | $578,200 | $435,700 | $142,500 |
| 2023 | $6,888 | $544,900 | $409,000 | $135,900 |
| 2022 | $6,685 | $501,100 | $372,300 | $128,800 |
| 2021 | $6,433 | $472,700 | $351,900 | $120,800 |
| 2020 | $6,225 | $457,400 | $336,600 | $120,800 |
| 2019 | $5,814 | $457,400 | $336,600 | $120,800 |
| 2018 | $5,212 | $399,400 | $306,000 | $93,400 |
| 2017 | $4,914 | $364,300 | $272,500 | $91,800 |
| 2016 | $4,728 | $348,400 | $257,500 | $90,900 |
| 2015 | $4,711 | $340,900 | $257,500 | $83,400 |
Source: Public Records
Map
Nearby Homes