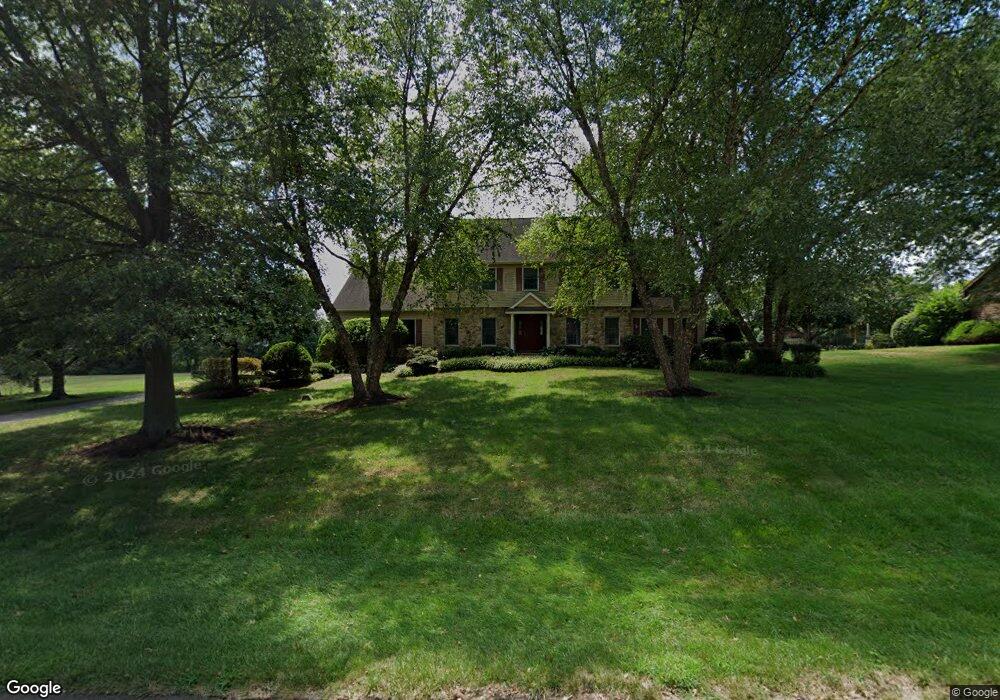
7 Roberts Dr Westampton, NJ 08060
Estimated Value: $702,177 - $792,000
Studio
--
Bath
3,366
Sq Ft
$220/Sq Ft
Est. Value
About This Home
This home is located at 7 Roberts Dr, Westampton, NJ 08060 and is currently estimated at $739,794, approximately $219 per square foot. 7 Roberts Dr is a home located in Burlington County with nearby schools including Holly Hills Elementary School, Westampton Intermediate School, and Rancocas Valley Regional High School.
Ownership History
Date
Name
Owned For
Owner Type
Purchase Details
Closed on
Mar 16, 1999
Sold by
Sweeney Construction Company Inc
Bought by
Peterson John W and Peterson Dolores D
Current Estimated Value
Home Financials for this Owner
Home Financials are based on the most recent Mortgage that was taken out on this home.
Original Mortgage
$347,850
Outstanding Balance
$84,403
Interest Rate
6.78%
Estimated Equity
$655,391
Create a Home Valuation Report for This Property
The Home Valuation Report is an in-depth analysis detailing your home's value as well as a comparison with similar homes in the area
Home Values in the Area
Average Home Value in this Area
Purchase History
| Date | Buyer | Sale Price | Title Company |
|---|---|---|---|
| Peterson John W | $80,000 | New Jersey Title Insurance C |
Source: Public Records
Mortgage History
| Date | Status | Borrower | Loan Amount |
|---|---|---|---|
| Open | Peterson John W | $347,850 |
Source: Public Records
Tax History
| Year | Tax Paid | Tax Assessment Tax Assessment Total Assessment is a certain percentage of the fair market value that is determined by local assessors to be the total taxable value of land and additions on the property. | Land | Improvement |
|---|---|---|---|---|
| 2025 | $11,930 | $424,700 | $90,500 | $334,200 |
| 2024 | $11,480 | $424,700 | $90,500 | $334,200 |
| 2023 | $11,480 | $424,700 | $90,500 | $334,200 |
| 2022 | $10,842 | $422,200 | $90,500 | $331,700 |
| 2021 | $10,441 | $422,200 | $90,500 | $331,700 |
| 2020 | $10,399 | $422,200 | $90,500 | $331,700 |
| 2019 | $10,188 | $422,200 | $90,500 | $331,700 |
| 2018 | $10,057 | $422,200 | $90,500 | $331,700 |
| 2017 | $9,791 | $422,200 | $90,500 | $331,700 |
| 2016 | $9,609 | $422,200 | $90,500 | $331,700 |
| 2015 | $9,424 | $422,200 | $90,500 | $331,700 |
| 2014 | $9,183 | $422,200 | $90,500 | $331,700 |
Source: Public Records
Map
Nearby Homes
- 39 Fernbrooke Dr
- 10 Stratford Ct
- 26 Sawgrass Dr
- 204 Dale Rd
- 430 W Country Club Dr
- 206 Dogwood Dr
- 724 Woodlane Rd
- 4 Brighton Ct
- 118 Greenwich Dr
- 18 Dryden Dr
- 19 Dryden Dr
- 19 Quail Hollow Dr
- 70 Tarnsfield Rd
- 11 Dryden Dr
- 30 Spyglass Ct
- 11 Beechwood Ave
- 216 Blue Jay Ln
- 44 Wesley Ln
- 56 Greenwich Dr
- 402 Pennington Dr Unit 200
Your Personal Tour Guide
Ask me questions while you tour the home.