Estimated Value: $316,000 - $374,000
--
Bed
2
Baths
2,870
Sq Ft
$125/Sq Ft
Est. Value
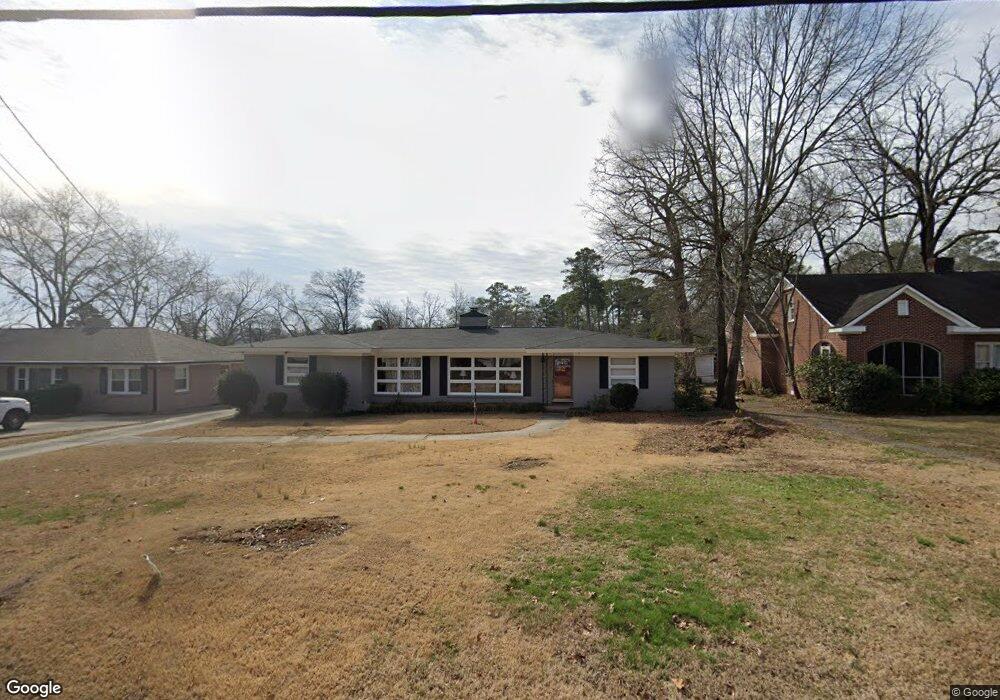
About This Home
This home is located at 7 Robin St NW, Rome, GA 30165 and is currently estimated at $358,080, approximately $124 per square foot. 7 Robin St NW is a home located in Floyd County with nearby schools including Rome High School and Unity Christian School.
Ownership History
Date
Name
Owned For
Owner Type
Purchase Details
Closed on
Sep 27, 1999
Sold by
Ledbetter Joseph D
Bought by
Roland David E and Roland Margaret G
Current Estimated Value
Purchase Details
Closed on
Jul 30, 1998
Sold by
Canada Kim A and Canada Pamela P
Bought by
Ledbetter Joseph D
Purchase Details
Closed on
Aug 16, 1988
Sold by
Jones Philip and Jones Elizabeth H
Bought by
Canada Kim A and Canada Pamela P
Purchase Details
Closed on
Sep 28, 1984
Sold by
Wilson Wilson D and Wilson Julia J
Bought by
Jones Philip and Jones Elizabeth H
Purchase Details
Closed on
Feb 28, 1967
Sold by
Carlson Glenn D and Carlson Sarah W
Bought by
Wilson Wilson D and Wilson Julia J
Purchase Details
Closed on
Feb 18, 1966
Sold by
The Upjohn Co
Bought by
Carlson Glenn D and Carlson Sarah W
Purchase Details
Closed on
Sep 20, 1965
Sold by
Crook Clyde D
Bought by
The Upjohn Co
Purchase Details
Closed on
Aug 25, 1964
Sold by
Hubert Robert R
Bought by
Crook Clyde D
Purchase Details
Closed on
Jun 15, 1962
Sold by
Buttram A J
Bought by
Hubert Robert R
Purchase Details
Closed on
Jan 1, 1901
Bought by
Buttram A J
Create a Home Valuation Report for This Property
The Home Valuation Report is an in-depth analysis detailing your home's value as well as a comparison with similar homes in the area
Home Values in the Area
Average Home Value in this Area
Purchase History
| Date | Buyer | Sale Price | Title Company |
|---|---|---|---|
| Roland David E | $125,000 | -- | |
| Ledbetter Joseph D | $120,000 | -- | |
| Canada Kim A | $83,000 | -- | |
| Jones Philip | $63,000 | -- | |
| Wilson Wilson D | $26,200 | -- | |
| Carlson Glenn D | -- | -- | |
| The Upjohn Co | -- | -- | |
| Crook Clyde D | $28,500 | -- | |
| Hubert Robert R | -- | -- | |
| Buttram A J | -- | -- |
Source: Public Records
Tax History Compared to Growth
Tax History
| Year | Tax Paid | Tax Assessment Tax Assessment Total Assessment is a certain percentage of the fair market value that is determined by local assessors to be the total taxable value of land and additions on the property. | Land | Improvement |
|---|---|---|---|---|
| 2024 | $3,045 | $153,110 | $15,923 | $137,187 |
| 2023 | $3,002 | $126,106 | $14,475 | $111,631 |
| 2022 | $2,937 | $104,344 | $11,942 | $92,402 |
| 2021 | $2,706 | $91,796 | $11,942 | $79,854 |
| 2020 | $2,591 | $84,163 | $9,047 | $75,116 |
| 2019 | $2,418 | $75,375 | $9,047 | $66,328 |
| 2018 | $2,342 | $70,940 | $9,047 | $61,893 |
| 2017 | $2,297 | $68,295 | $9,047 | $59,248 |
| 2016 | $2,274 | $66,582 | $9,040 | $57,542 |
| 2015 | $2,157 | $66,582 | $9,040 | $57,542 |
| 2014 | $2,157 | $66,582 | $9,040 | $57,542 |
Source: Public Records
Map
Nearby Homes
- 4 Colonial Dr NW
- 7 Raymond Ave NW
- 204 Oakwood St NW
- 208 Dodd St NW
- 14 Vineland Dr NW
- 0 Unbridled Rd Unit 22 23074684
- 614 Briarwood Cir NW
- 527 W 11th St NE
- 1005 N 2nd Ave NW Unit 39
- PEARSON Plan at Shorter Village
- 808 Charlton St NW
- 601 W 10th St NE
- 1006 Avenue A NE
- 9 Shorter Cir SW
- 209 Sherwood Rd SW
- 715 Avenue A NE
- 6 Horseleg Creek Rd SW
- 17 Rosewood Rd SW
- 124 Sheridan Dr NW
- 0 Cypress St NE Unit 7494593
- 9 Robin St NW
- 5 Robin St NW
- 11 Robin St NW
- 14 Charlton St NW
- 14 Charlton St NW
- 10 Charlton St NW
- 100 Leland Ave NW
- 13 Robin St NW
- 4 Robin St NW
- 6 Robin St NW
- 12 Charlton St NW
- 8 Robin St NW
- 10 Robin St NW
- 10 Robin St NW
- 1711 Martha Berry Blvd NW
- 18 Charlton St NW
- 8 Charlton St NW
- 0 Robin St NW Unit 7288804
- 0 Robin St NW Unit 8540463
- 0 Robin St NW Unit 8313295