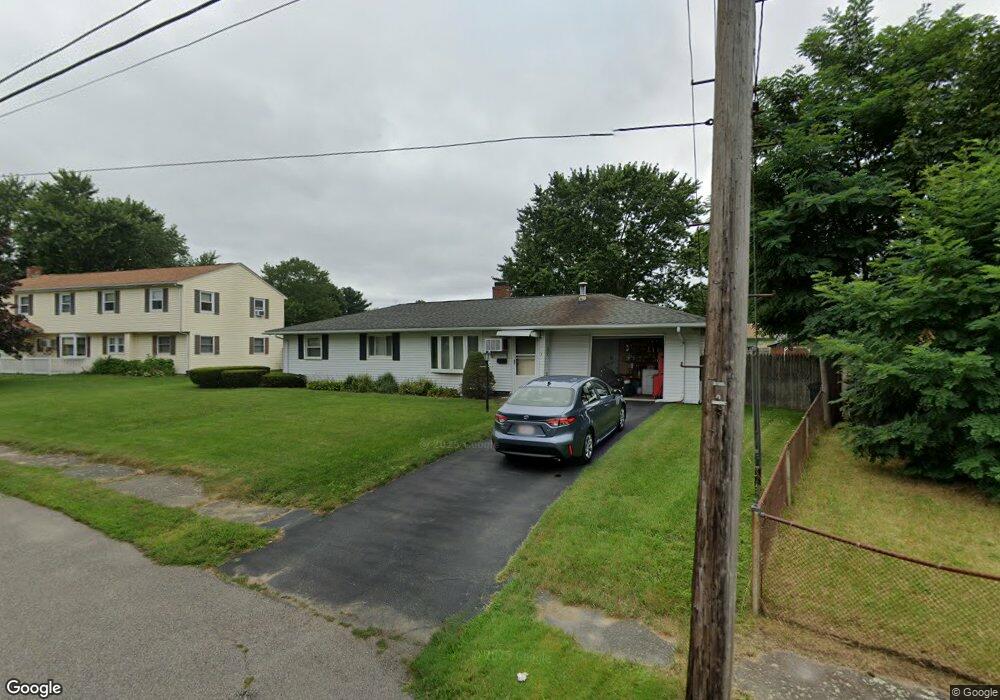
7 Roger Rd Holbrook, MA 02343
Estimated Value: $505,572 - $533,000
3
Beds
1
Bath
1,544
Sq Ft
$333/Sq Ft
Est. Value
About This Home
This home is located at 7 Roger Rd, Holbrook, MA 02343 and is currently estimated at $513,893, approximately $332 per square foot. 7 Roger Rd is a home located in Norfolk County with nearby schools including John F. Kennedy Elementary School, Holbrook Middle High School, and Boston Higashi School.
Ownership History
Date
Name
Owned For
Owner Type
Purchase Details
Closed on
Dec 14, 2022
Sold by
Spicuzza Donald and Spicuzza Christine M
Bought by
Donald Spicuzza Irt and Spicuzza
Current Estimated Value
Create a Home Valuation Report for This Property
The Home Valuation Report is an in-depth analysis detailing your home's value as well as a comparison with similar homes in the area
Home Values in the Area
Average Home Value in this Area
Purchase History
| Date | Buyer | Sale Price | Title Company |
|---|---|---|---|
| Donald Spicuzza Irt | -- | None Available | |
| Donald Spicuzza Irt | -- | None Available | |
| Donald Spicuzza Irt | -- | None Available |
Source: Public Records
Tax History
| Year | Tax Paid | Tax Assessment Tax Assessment Total Assessment is a certain percentage of the fair market value that is determined by local assessors to be the total taxable value of land and additions on the property. | Land | Improvement |
|---|---|---|---|---|
| 2025 | $58 | $440,600 | $254,600 | $186,000 |
| 2024 | $5,494 | $408,800 | $231,400 | $177,400 |
| 2023 | $5,818 | $378,300 | $210,500 | $167,800 |
| 2022 | $5,396 | $327,200 | $183,000 | $144,200 |
| 2021 | $5,242 | $304,400 | $167,700 | $136,700 |
| 2020 | $5,272 | $287,000 | $156,700 | $130,300 |
| 2019 | $5,318 | $273,300 | $149,300 | $124,000 |
| 2018 | $5,230 | $253,000 | $133,300 | $119,700 |
| 2017 | $4,951 | $236,900 | $121,400 | $115,500 |
| 2016 | $4,523 | $230,300 | $121,400 | $108,900 |
| 2015 | $4,070 | $213,300 | $109,500 | $103,800 |
| 2014 | $3,720 | $198,200 | $99,500 | $98,700 |
Source: Public Records
Map
Nearby Homes
- 360 Plymouth St
- 45-R Ernest St
- 63 Sycamore St
- 88 Roseen Rd
- 181 S Franklin St Unit 102
- 181 S Franklin St Unit 206
- 152 S Franklin St
- 35 Marion St
- 123-125 N Franklin St
- 58 Chandler St
- 184 Belcher St
- 95 Rindone St
- 375 S Franklin St Unit 1
- 36 Summer St
- 27 Winter St
- 24 Reeds Ln
- 278 N Franklin St
- 5 Clarendon Cir Unit Lot 4
- 52 Quincy St
- 8 Dianthus Rd
Your Personal Tour Guide
Ask me questions while you tour the home.