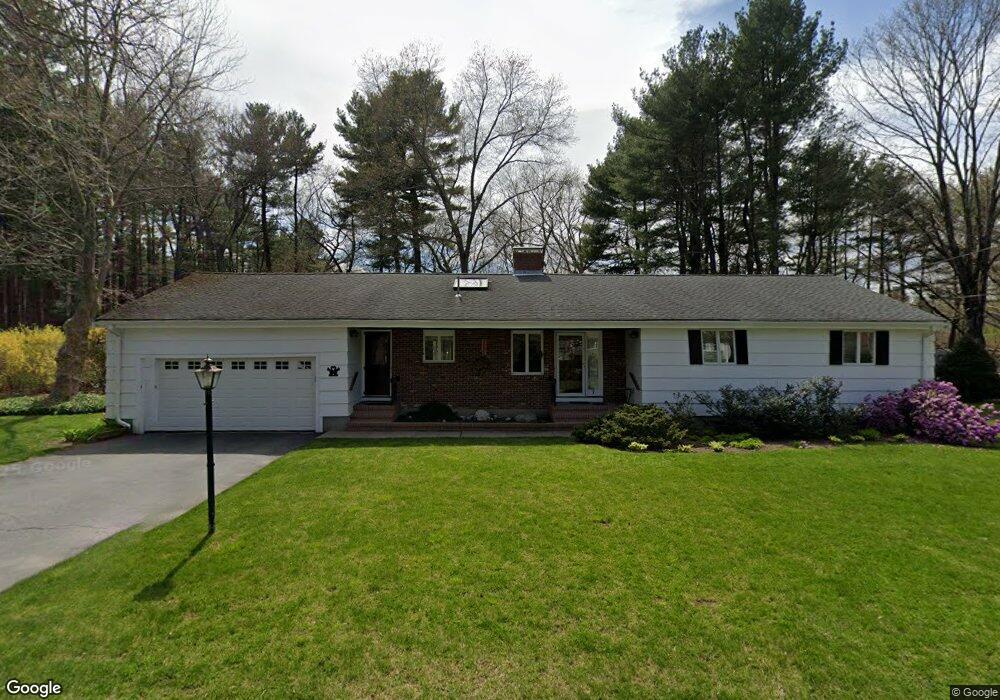
7 Rolling Ln Wayland, MA 01778
Estimated Value: $990,000 - $1,151,000
3
Beds
3
Baths
1,835
Sq Ft
$582/Sq Ft
Est. Value
About This Home
This home is located at 7 Rolling Ln, Wayland, MA 01778 and is currently estimated at $1,067,281, approximately $581 per square foot. 7 Rolling Ln is a home located in Middlesex County with nearby schools including Wayland High School and Veritas Christian Academy.
Ownership History
Date
Name
Owned For
Owner Type
Purchase Details
Closed on
Mar 30, 2017
Sold by
Vonrohr Margaret T and Vonrohr John A
Bought by
Vonrohr Rt
Current Estimated Value
Purchase Details
Closed on
Mar 15, 1993
Sold by
Pj Mccarthy Rt and Mccarthy
Bought by
Vonrohr John A and Von Rohr Margaret
Create a Home Valuation Report for This Property
The Home Valuation Report is an in-depth analysis detailing your home's value as well as a comparison with similar homes in the area
Home Values in the Area
Average Home Value in this Area
Purchase History
| Date | Buyer | Sale Price | Title Company |
|---|---|---|---|
| Vonrohr Rt | -- | -- | |
| Vonrohr Rt | -- | -- | |
| Vonrohr John A | $251,000 | -- |
Source: Public Records
Mortgage History
| Date | Status | Borrower | Loan Amount |
|---|---|---|---|
| Previous Owner | Vonrohr John A | $265,000 | |
| Previous Owner | Vonrohr John A | $240,000 | |
| Previous Owner | Vonrohr John A | $248,000 |
Source: Public Records
Tax History
| Year | Tax Paid | Tax Assessment Tax Assessment Total Assessment is a certain percentage of the fair market value that is determined by local assessors to be the total taxable value of land and additions on the property. | Land | Improvement |
|---|---|---|---|---|
| 2025 | $14,788 | $946,100 | $548,700 | $397,400 |
| 2024 | $13,996 | $901,800 | $522,600 | $379,200 |
| 2023 | $13,583 | $815,800 | $475,100 | $340,700 |
| 2022 | $12,283 | $669,400 | $393,500 | $275,900 |
| 2021 | $11,697 | $631,600 | $357,700 | $273,900 |
| 2020 | $11,217 | $631,600 | $357,700 | $273,900 |
| 2019 | $11,436 | $625,600 | $340,800 | $284,800 |
| 2018 | $5,349 | $584,200 | $340,800 | $243,400 |
| 2017 | $10,409 | $573,800 | $330,400 | $243,400 |
| 2016 | $9,839 | $567,400 | $324,000 | $243,400 |
| 2015 | $10,434 | $567,400 | $324,000 | $243,400 |
Source: Public Records
Map
Nearby Homes
- 218 Old Connecticut Path
- 1 Cole Rd
- 37 Davelin Rd
- 22 Pine Ridge Rd
- 22 Lake Shore Dr
- 26 Pine Ridge Rd
- 108 Dudley Rd
- 123 Dudley Rd
- 225 W Plain St
- 26 Jeffrey Rd
- 186 Main St
- 45 W Plain St Unit 1
- 1 Winthrop Terrace
- 1605 Wisteria Way
- 18 Jay Dr
- 13 Potter Rd
- 1 Foley Dr
- 12 Cutting Cross Way
- 16 Coltsway Unit 16CW
- 5 Pickwick Way
- 9 Rolling Ln
- 5 Rolling Ln
- 8 Rolling Ln
- 10 Rolling Ln
- 3 Rolling Ln
- 11 Rolling Ln
- 6 Rolling Ln
- 245 Old Connecticut Path
- 1 Rolling Ln
- 4 Nolan Farm Rd
- 2 Rolling Ln
- 13 Rolling Ln
- 14 Rolling Ln
- 249 Old Connecticut Path
- 16 Rolling Ln
- 7 Old Farm Rd
- 9 Old Farm Rd
- 5 Old Farm Rd
- 237 Old Connecticut Path
- 17 Rolling Ln
Your Personal Tour Guide
Ask me questions while you tour the home.