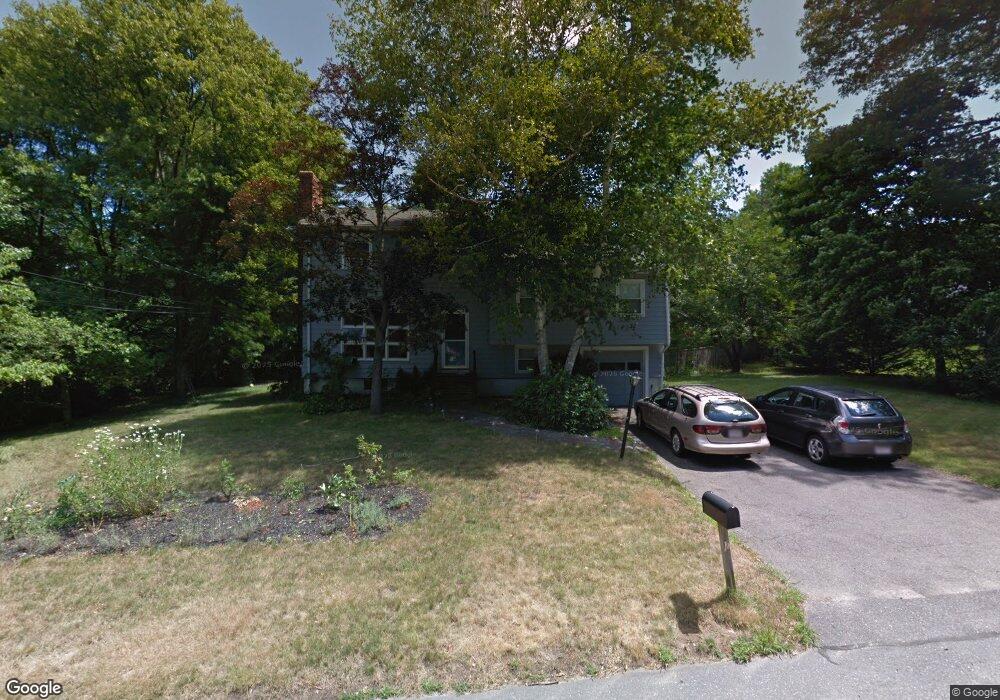
7 Ross Rd Lexington, MA 02421
North Lexington NeighborhoodEstimated Value: $1,185,000 - $1,325,700
3
Beds
2
Baths
1,126
Sq Ft
$1,116/Sq Ft
Est. Value
About This Home
This home is located at 7 Ross Rd, Lexington, MA 02421 and is currently estimated at $1,256,675, approximately $1,116 per square foot. 7 Ross Rd is a home located in Middlesex County with nearby schools including Maria Hastings Elementary School, William Diamond Middle School, and Lexington High School.
Ownership History
Date
Name
Owned For
Owner Type
Purchase Details
Closed on
Feb 17, 1998
Sold by
Joyce Catherine
Bought by
Lockshin Mary P and Lockshin Curtis A
Current Estimated Value
Home Financials for this Owner
Home Financials are based on the most recent Mortgage that was taken out on this home.
Original Mortgage
$212,500
Interest Rate
6.95%
Mortgage Type
Purchase Money Mortgage
Purchase Details
Closed on
Aug 31, 1989
Sold by
Callerame Joseph
Bought by
Galvin Catherine M
Home Financials for this Owner
Home Financials are based on the most recent Mortgage that was taken out on this home.
Original Mortgage
$150,000
Interest Rate
9.7%
Mortgage Type
Purchase Money Mortgage
Create a Home Valuation Report for This Property
The Home Valuation Report is an in-depth analysis detailing your home's value as well as a comparison with similar homes in the area
Home Values in the Area
Average Home Value in this Area
Purchase History
| Date | Buyer | Sale Price | Title Company |
|---|---|---|---|
| Lockshin Mary P | $250,000 | -- | |
| Galvin Catherine M | $219,800 | -- |
Source: Public Records
Mortgage History
| Date | Status | Borrower | Loan Amount |
|---|---|---|---|
| Open | Galvin Catherine M | $300,000 | |
| Closed | Galvin Catherine M | $66,000 | |
| Closed | Galvin Catherine M | $212,500 | |
| Previous Owner | Galvin Catherine M | $150,000 |
Source: Public Records
Tax History Compared to Growth
Tax History
| Year | Tax Paid | Tax Assessment Tax Assessment Total Assessment is a certain percentage of the fair market value that is determined by local assessors to be the total taxable value of land and additions on the property. | Land | Improvement |
|---|---|---|---|---|
| 2025 | $11,985 | $980,000 | $606,000 | $374,000 |
| 2024 | $11,650 | $951,000 | $577,000 | $374,000 |
| 2023 | $11,089 | $853,000 | $525,000 | $328,000 |
| 2022 | $10,336 | $749,000 | $477,000 | $272,000 |
| 2021 | $10,289 | $715,000 | $454,000 | $261,000 |
| 2020 | $10,158 | $723,000 | $454,000 | $269,000 |
| 2019 | $9,870 | $699,000 | $433,000 | $266,000 |
| 2018 | $3,593 | $673,000 | $412,000 | $261,000 |
| 2017 | $9,419 | $650,000 | $393,000 | $257,000 |
| 2016 | $9,388 | $643,000 | $374,000 | $269,000 |
| 2015 | $8,990 | $605,000 | $340,000 | $265,000 |
| 2014 | $7,957 | $513,000 | $309,000 | $204,000 |
Source: Public Records
Map
Nearby Homes
- 6 Revolutionary Rd
- 30 Harbell St
- 18 Greenwood St
- 2663 Massachusetts Ave
- 46 Asbury St
- 21 Balfour St
- 2520 Massachusetts Ave
- 2380 Massachusetts Ave
- 50 School St
- 24 Deering Ave
- 19 Deering Ave
- 7 Carmel Cir
- 671 Marrett Rd
- 5 Leroy Rd
- 24 Vaille Ave
- 93 Bedford St Unit 201
- 93 Bedford St Unit 308
- 93 Bedford St Unit 101
- 231 Bedford St
- 32 Forest St