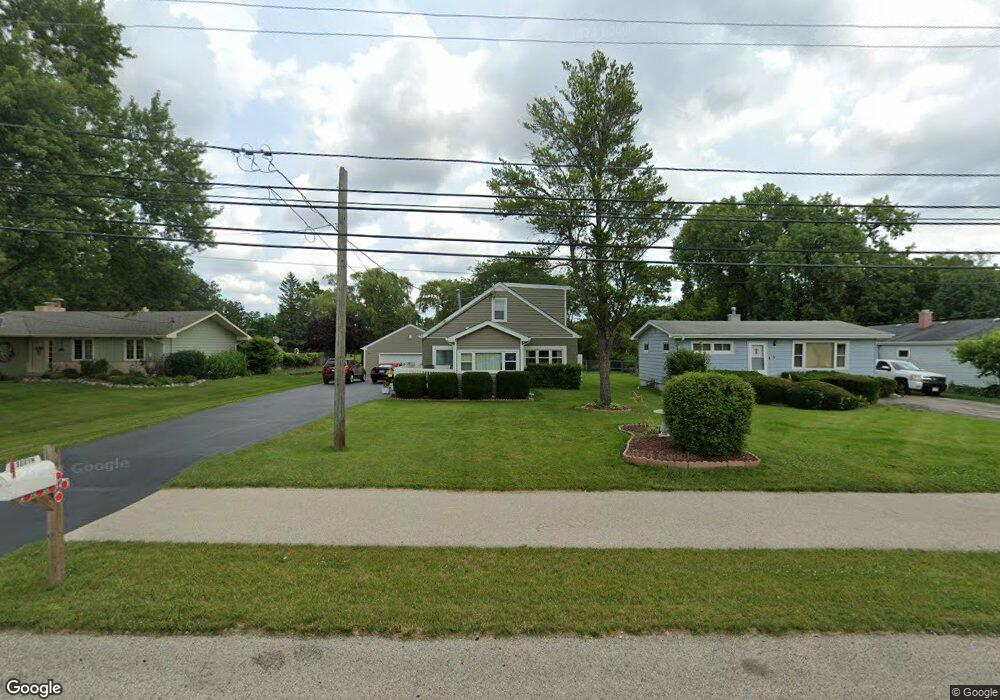
7 S Cedar Lake Rd Round Lake, IL 60073
Estimated Value: $242,597 - $286,000
2
Beds
1
Bath
1,174
Sq Ft
$221/Sq Ft
Est. Value
About This Home
This home is located at 7 S Cedar Lake Rd, Round Lake, IL 60073 and is currently estimated at $259,899, approximately $221 per square foot. 7 S Cedar Lake Rd is a home located in Lake County with nearby schools including Village Elementary School, John T. Magee Middle School, and Round Lake High School.
Ownership History
Date
Name
Owned For
Owner Type
Purchase Details
Closed on
Dec 3, 2002
Sold by
Leintz Adam Troy and Leintz Angela
Bought by
Harper Pennye D
Current Estimated Value
Home Financials for this Owner
Home Financials are based on the most recent Mortgage that was taken out on this home.
Original Mortgage
$115,200
Interest Rate
6%
Purchase Details
Closed on
Mar 18, 1999
Sold by
Leintz Adam Troy
Bought by
Leintz Adam Troy and Leintz Angela
Home Financials for this Owner
Home Financials are based on the most recent Mortgage that was taken out on this home.
Original Mortgage
$36,300
Interest Rate
6.94%
Purchase Details
Closed on
Mar 10, 1994
Sold by
Galford John M and Galford Kimberly Ann
Bought by
Lentz Adam Troy
Home Financials for this Owner
Home Financials are based on the most recent Mortgage that was taken out on this home.
Original Mortgage
$73,800
Interest Rate
7.04%
Create a Home Valuation Report for This Property
The Home Valuation Report is an in-depth analysis detailing your home's value as well as a comparison with similar homes in the area
Home Values in the Area
Average Home Value in this Area
Purchase History
| Date | Buyer | Sale Price | Title Company |
|---|---|---|---|
| Harper Pennye D | $144,000 | St | |
| Leintz Adam Troy | -- | -- | |
| Lentz Adam Troy | $54,666 | Chicago Title Insurance Co |
Source: Public Records
Mortgage History
| Date | Status | Borrower | Loan Amount |
|---|---|---|---|
| Previous Owner | Harper Pennye D | $115,200 | |
| Previous Owner | Leintz Adam Troy | $36,300 | |
| Previous Owner | Lentz Adam Troy | $73,800 |
Source: Public Records
Tax History Compared to Growth
Tax History
| Year | Tax Paid | Tax Assessment Tax Assessment Total Assessment is a certain percentage of the fair market value that is determined by local assessors to be the total taxable value of land and additions on the property. | Land | Improvement |
|---|---|---|---|---|
| 2024 | $4,166 | $59,180 | $19,807 | $39,373 |
| 2023 | $4,093 | $57,171 | $19,134 | $38,037 |
| 2022 | $4,093 | $50,642 | $9,420 | $41,222 |
| 2021 | $2,527 | $33,139 | $9,054 | $24,085 |
| 2020 | $3,136 | $38,191 | $8,615 | $29,576 |
| 2019 | $3,029 | $36,641 | $8,265 | $28,376 |
| 2018 | $4,126 | $36,900 | $10,670 | $26,230 |
| 2017 | $4,035 | $34,710 | $10,037 | $24,673 |
| 2016 | $3,849 | $32,041 | $9,265 | $22,776 |
| 2015 | $3,713 | $29,272 | $8,464 | $20,808 |
| 2014 | $3,516 | $28,552 | $6,864 | $21,688 |
| 2012 | $3,537 | $29,820 | $7,169 | $22,651 |
Source: Public Records
Map
Nearby Homes
- 13 Lincoln Ave
- 33 S Treehouse Ln Unit 73
- 108 Lincoln Ave
- 321 W Whispering Oaks Ln Unit 336
- 30 S Macgillis Dr Unit 201
- 47 S Treehouse Ln Unit 83
- 337 W Treehouse Ln Unit 112
- 0 S Cedar Lake Rd Unit MRD12365608
- 175 Davis Ct
- 472 W Savoy Dr
- 352 Linden Dr
- 659 S Rosehall Ln
- 602 S Rosehall Ln
- 230 Brierhill Dr
- 124 W Buckingham Dr Unit 134
- 114 Clifton Dr
- 123 E Pineview Dr
- 221 Kenwood Dr
- 407 Greenwood Dr
- 714 S Rosehall Ln Unit 3
- 9 S Cedar Lake Rd
- 5 S Cedar Lake Rd
- 11 S Cedar Lake Rd
- 1 S Cedar Lake Rd
- 1 S Cedar Lake Rd
- 3 N Cedar Lake Rd
- 508 W Forest Ave
- 504 W Forest Ave
- 504 W Forest Ave
- 7 N Cedar Lake Rd
- 515 W Park Ave
- 517 W Park Ave
- 511 W Park Ave
- 507 W Park Ave
- 505 W Park Ave
- 509 W Park Ave
- 420 W Forest Ave
- 503 W Park Ave
- 501 W Park Ave
- 514 W Park Ave