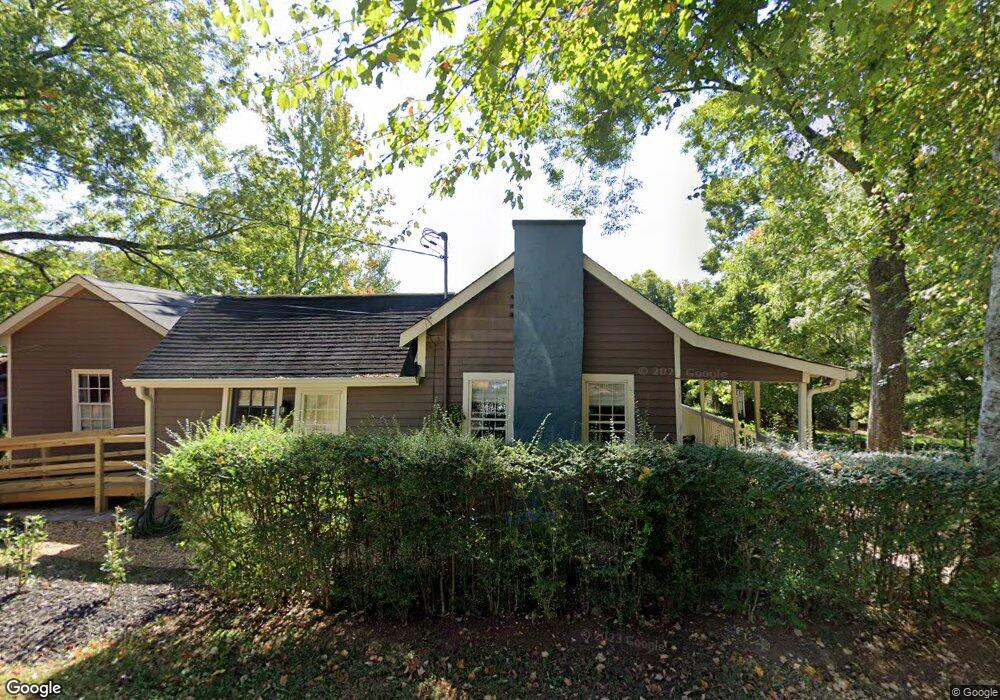
7 S Derrick St Dahlonega, GA 30533
Estimated Value: $242,766 - $373,000
--
Bed
1
Bath
1,129
Sq Ft
$251/Sq Ft
Est. Value
About This Home
This home is located at 7 S Derrick St, Dahlonega, GA 30533 and is currently estimated at $282,942, approximately $250 per square foot. 7 S Derrick St is a home located in Lumpkin County with nearby schools including Clay County Middle School and Lumpkin County High School.
Ownership History
Date
Name
Owned For
Owner Type
Purchase Details
Closed on
Aug 19, 2015
Sold by
Wilkins Terri H
Bought by
Sampson Cordle Kenneth Joel and Cordle Alice Sampson
Current Estimated Value
Home Financials for this Owner
Home Financials are based on the most recent Mortgage that was taken out on this home.
Original Mortgage
$81,520
Interest Rate
4.09%
Mortgage Type
New Conventional
Purchase Details
Closed on
Jun 23, 2015
Sold by
Palmer Joseph W
Bought by
Wilkins Terri H
Home Financials for this Owner
Home Financials are based on the most recent Mortgage that was taken out on this home.
Original Mortgage
$81,520
Interest Rate
4.09%
Mortgage Type
New Conventional
Purchase Details
Closed on
Apr 3, 1991
Sold by
Palmer Joseph W
Bought by
Grindle Maggie P
Purchase Details
Closed on
Apr 1, 1979
Bought by
Grindle Maggie P
Create a Home Valuation Report for This Property
The Home Valuation Report is an in-depth analysis detailing your home's value as well as a comparison with similar homes in the area
Home Values in the Area
Average Home Value in this Area
Purchase History
| Date | Buyer | Sale Price | Title Company |
|---|---|---|---|
| Sampson Cordle Kenneth Joel | $75,000 | -- | |
| Wilkins Terri H | $60,000 | -- | |
| Grindle Maggie P | -- | -- | |
| Grindle Maggie P | -- | -- |
Source: Public Records
Mortgage History
| Date | Status | Borrower | Loan Amount |
|---|---|---|---|
| Closed | Sampson Cordle Kenneth Joel | $81,520 | |
| Previous Owner | Wilkins Terri H | $56,000 |
Source: Public Records
Tax History Compared to Growth
Tax History
| Year | Tax Paid | Tax Assessment Tax Assessment Total Assessment is a certain percentage of the fair market value that is determined by local assessors to be the total taxable value of land and additions on the property. | Land | Improvement |
|---|---|---|---|---|
| 2024 | $34 | $67,351 | $15,400 | $51,951 |
| 2023 | $0 | $43,653 | $15,400 | $28,253 |
| 2022 | $1,211 | $39,641 | $15,400 | $24,241 |
| 2021 | $1,234 | $33,908 | $15,400 | $18,508 |
| 2020 | $1,073 | $33,323 | $15,400 | $17,923 |
| 2019 | $1,079 | $33,323 | $15,400 | $17,923 |
| 2018 | $1,072 | $31,113 | $15,400 | $15,713 |
| 2017 | $1,076 | $30,710 | $15,400 | $15,310 |
| 2016 | $1,103 | $29,169 | $15,400 | $13,769 |
| 2015 | -- | $21,671 | $15,400 | $6,271 |
| 2014 | -- | $21,861 | $15,400 | $6,461 |
| 2013 | -- | $22,240 | $15,400 | $6,840 |
Source: Public Records
Map
Nearby Homes
- 120 Riley Rd
- 329 Morrison Moore Pkwy E
- 6480A Highway 52
- 0 Highway 60 Unit 7241582
- 1392 S Chestatee St
- 0 Highway 9 S Unit 10487179
- 0 Highway 9 S Unit 7548614
- 0 S Chestatee St Unit 10619536
- 0 Highway 19 N Unit 10594984
- 168 W Main St
- 0 Calhoun Rd Unit 7643314
- 0 Calhoun Rd Unit 10598012
- 00 Calhoun Rd
- 315 Church St
- 95 Jones St
- 0 Alicia Ln
- 399 N Chestatee St
- 19 Stoneybrook Dr
- 502 Wimpy Mill Rd
- 0 Crown Mountain Unit 7682225
- 10 Strada Valichauna Unit B
- 6 Strada Valdichiana Unit A
- 2 Strada Valdichian Unit 2 A
- 0 Strada Valdichiana Unit 2922531
- 0 Strada Valdichiana Unit B4 2963377
- 0 Strada Valdichiana Unit A3 3023040
- 0 Strada Valdichiana Unit B 7 3043047
- 0 Strada Valdichiana Unit B 6 3043021
- 0 Strada Valdichiana Unit LOT 3B 3123160
- 0 Strada Valdichiana Unit LOT 4 3146900
- 0 Strada Valdichiana Unit LOT A6 3168794
- 0 Strada Valdichiana Unit 4A 7026062
- 0 Strada Valdichiana Unit 3A 7026055
- 0 Strada Valdichiana Unit LOT 3B 7170589
- 0 Strada Valdichiana Unit LOT A2 7174959
- 0 Strada Valdichiana Unit B 6 7175580
- 0 Strada Valdichiana Unit 7B 7626531
- 0 Strada Valdichiana Unit 6B 8084295
- 0 Strada Valdichiana
- 0 Strada Valdichiana Unit 8361585