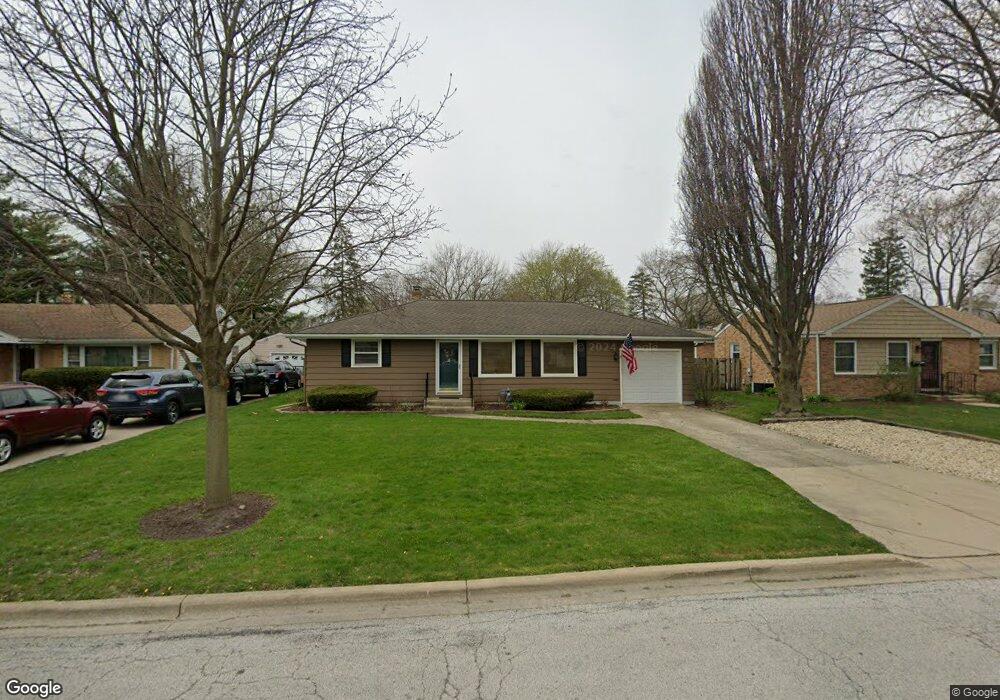
7 S Glenwood Place Aurora, IL 60506
Blackhawk NeighborhoodEstimated Value: $267,000 - $290,000
2
Beds
1
Bath
936
Sq Ft
$299/Sq Ft
Est. Value
About This Home
This home is located at 7 S Glenwood Place, Aurora, IL 60506 and is currently estimated at $279,571, approximately $298 per square foot. 7 S Glenwood Place is a home located in Kane County with nearby schools including Freeman Elementary School, Washington Middle School, and West Aurora High School.
Ownership History
Date
Name
Owned For
Owner Type
Purchase Details
Closed on
Aug 19, 2025
Sold by
Richard A Lawrence A and Richard Annette S
Bought by
Concepcion Cristian and Gomez Hadassa
Current Estimated Value
Home Financials for this Owner
Home Financials are based on the most recent Mortgage that was taken out on this home.
Original Mortgage
$285,729
Outstanding Balance
$285,451
Interest Rate
6.12%
Mortgage Type
FHA
Estimated Equity
-$5,880
Purchase Details
Closed on
Jul 2, 2021
Sold by
Lawrence Richard A and Lawrence Annette S
Bought by
Lawrence Richard A and Lawrence Annette S
Purchase Details
Closed on
Aug 18, 2006
Sold by
Stanislao Andrew and Stanislao Bridget
Bought by
Lawrence Richard A and Lawrence Annette S
Purchase Details
Closed on
Sep 30, 2003
Sold by
Dormady Jason J and Dormady Bridget M
Bought by
Stanislo Andrew and Stanislo Bridget
Home Financials for this Owner
Home Financials are based on the most recent Mortgage that was taken out on this home.
Original Mortgage
$150,727
Interest Rate
6.04%
Mortgage Type
FHA
Purchase Details
Closed on
Apr 29, 1999
Sold by
Johnson Stanley R and Johnson Amy M
Bought by
Dormady Jason J and Podschweit Bridget M
Home Financials for this Owner
Home Financials are based on the most recent Mortgage that was taken out on this home.
Original Mortgage
$109,250
Interest Rate
6.99%
Create a Home Valuation Report for This Property
The Home Valuation Report is an in-depth analysis detailing your home's value as well as a comparison with similar homes in the area
Home Values in the Area
Average Home Value in this Area
Purchase History
| Date | Buyer | Sale Price | Title Company |
|---|---|---|---|
| Concepcion Cristian | -- | Fidelity National Title | |
| Lawrence Richard A | -- | None Available | |
| Lawrence Richard A | $185,500 | Chicago Title Insurance Co | |
| Stanislo Andrew | $155,000 | Chicago Title Insurance Co | |
| Dormady Jason J | $115,000 | Chicago Title Insurance Co |
Source: Public Records
Mortgage History
| Date | Status | Borrower | Loan Amount |
|---|---|---|---|
| Open | Concepcion Cristian | $285,729 | |
| Previous Owner | Stanislo Andrew | $150,727 | |
| Previous Owner | Dormady Jason J | $109,250 |
Source: Public Records
Tax History Compared to Growth
Tax History
| Year | Tax Paid | Tax Assessment Tax Assessment Total Assessment is a certain percentage of the fair market value that is determined by local assessors to be the total taxable value of land and additions on the property. | Land | Improvement |
|---|---|---|---|---|
| 2024 | $6,204 | $78,348 | $17,676 | $60,672 |
| 2023 | $5,996 | $70,003 | $15,793 | $54,210 |
| 2022 | $5,654 | $63,872 | $14,410 | $49,462 |
| 2021 | $5,150 | $56,370 | $10,320 | $46,050 |
| 2020 | $4,902 | $52,360 | $9,586 | $42,774 |
| 2019 | $4,981 | $50,934 | $8,882 | $42,052 |
| 2018 | $4,557 | $45,652 | $8,216 | $37,436 |
| 2017 | $4,568 | $44,386 | $7,570 | $36,816 |
| 2016 | $4,225 | $39,774 | $6,489 | $33,285 |
| 2015 | -- | $34,329 | $5,580 | $28,749 |
| 2014 | -- | $33,545 | $5,128 | $28,417 |
| 2013 | -- | $33,927 | $5,158 | $28,769 |
Source: Public Records
Map
Nearby Homes
- 231 W Downer Place
- 1543 W Downer Place
- 113 Stonewood Place Unit 6D
- 149 S Gladstone Ave
- 164 S Calumet Ave
- 203 S Calumet Ave
- 1730 W Galena Blvd Unit 402E
- 1735 Greene Ct
- 1751 Greene Ct
- 931 W Downer Place
- 930 W New York St Unit 932
- 943 Charles St
- 237 Ingleside Ave
- 850 W Galena Blvd
- 900 Charles St
- 175 S Harrison Ave
- 1351 Monomoy St Unit D
- 1389 Monomoy St Unit B2
- 833 N Randall Rd Unit C4
- 1104 New Haven Ave
- 11 S Glenwood Place
- 1 S Glenwood Place
- 1440 W Galena Blvd
- 15 S Glenwood Place
- 16 S Evanslawn Ave
- 21 S Glenwood Place
- 4 S Evanslawn Ave
- 20 S Evanslawn Ave
- 6 S Glenwood Place
- 2 S Glenwood Place
- 16 S Glenwood Place
- 24 S Evanslawn Ave
- 20 S Glenwood Place
- 1431 W Downer Place
- 1439 W Downer Place
- 1439 W Galena Blvd
- 1445 W Galena Blvd
- 1426 W Galena Blvd
- 1431 W Galena Blvd