7 Salem St Spencer, MA 01562
Estimated Value: $331,282 - $406,000
4
Beds
2
Baths
1,526
Sq Ft
$240/Sq Ft
Est. Value
About This Home
This home is located at 7 Salem St, Spencer, MA 01562 and is currently estimated at $366,571, approximately $240 per square foot. 7 Salem St is a home located in Worcester County with nearby schools including David Prouty High School.
Ownership History
Date
Name
Owned For
Owner Type
Purchase Details
Closed on
Jan 26, 2018
Sold by
Paul R Lapierre Sr Ret
Bought by
Lapierre Paul R
Current Estimated Value
Create a Home Valuation Report for This Property
The Home Valuation Report is an in-depth analysis detailing your home's value as well as a comparison with similar homes in the area
Home Values in the Area
Average Home Value in this Area
Purchase History
| Date | Buyer | Sale Price | Title Company |
|---|---|---|---|
| Lapierre Paul R | -- | -- |
Source: Public Records
Tax History
| Year | Tax Paid | Tax Assessment Tax Assessment Total Assessment is a certain percentage of the fair market value that is determined by local assessors to be the total taxable value of land and additions on the property. | Land | Improvement |
|---|---|---|---|---|
| 2025 | $30 | $255,900 | $43,100 | $212,800 |
| 2024 | $2,709 | $236,800 | $43,100 | $193,700 |
| 2023 | $2,594 | $215,100 | $43,100 | $172,000 |
| 2022 | $2,603 | $197,800 | $39,100 | $158,700 |
| 2021 | $2,270 | $161,700 | $39,100 | $122,600 |
| 2020 | $2,170 | $153,700 | $39,100 | $114,600 |
| 2019 | $2,024 | $146,000 | $35,400 | $110,600 |
| 2018 | $1,822 | $135,800 | $41,200 | $94,600 |
| 2017 | $1,883 | $134,700 | $39,100 | $95,600 |
| 2016 | $1,801 | $126,000 | $39,100 | $86,900 |
| 2015 | $1,800 | $131,700 | $43,500 | $88,200 |
| 2014 | $1,732 | $131,700 | $43,500 | $88,200 |
Source: Public Records
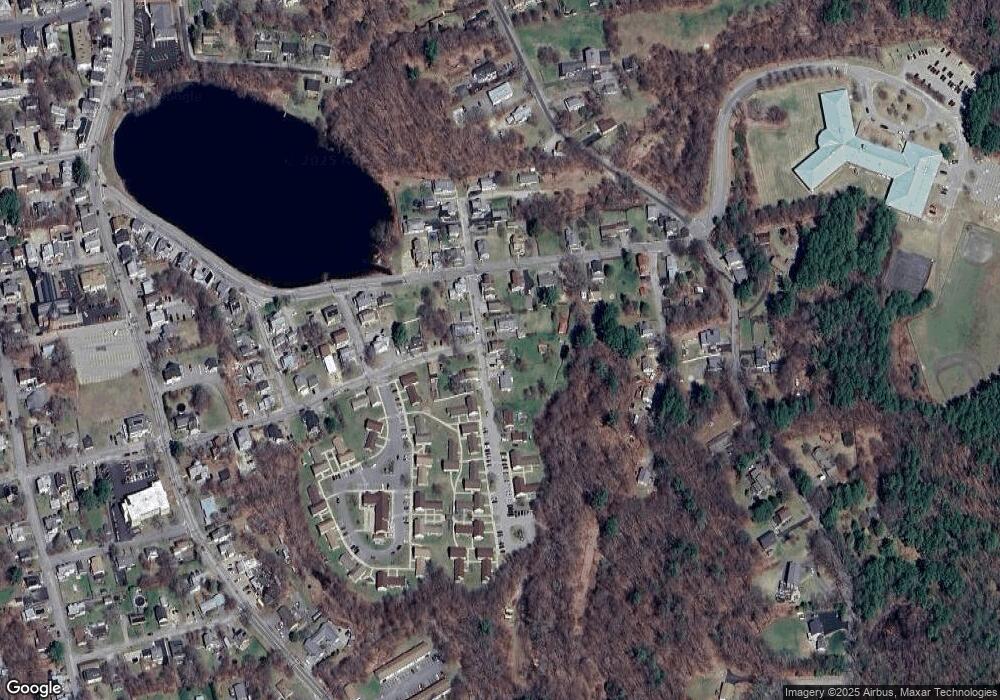
Map
Nearby Homes
Your Personal Tour Guide
Ask me questions while you tour the home.