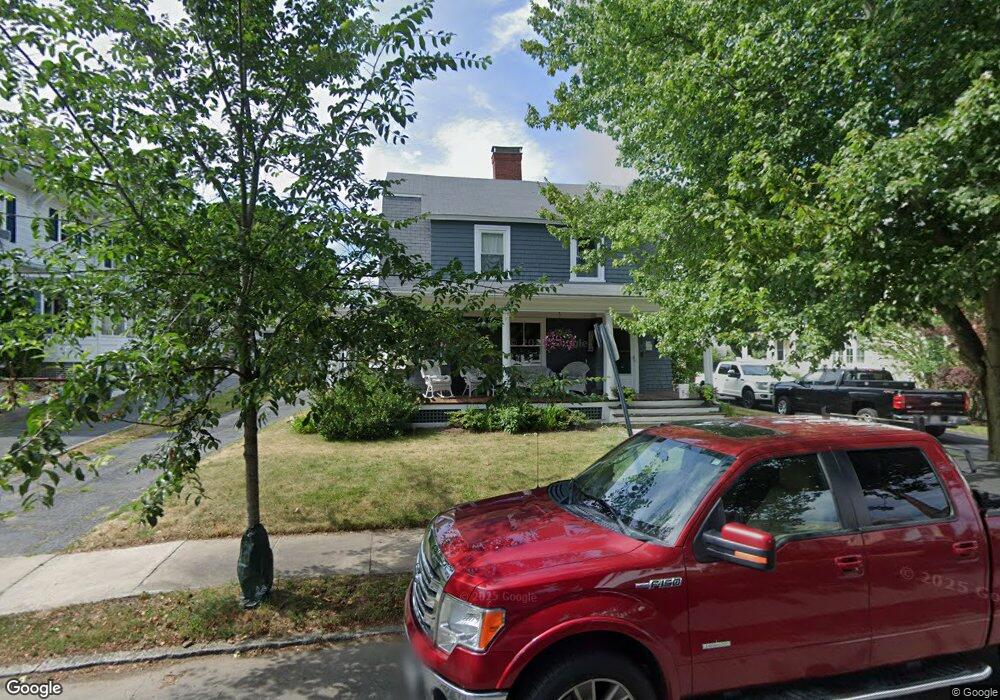
7 Savoy Rd Salem, MA 01970
South Salem NeighborhoodEstimated Value: $854,000 - $915,000
4
Beds
2
Baths
3,000
Sq Ft
$295/Sq Ft
Est. Value
About This Home
This home is located at 7 Savoy Rd, Salem, MA 01970 and is currently estimated at $885,917, approximately $295 per square foot. 7 Savoy Rd is a home located in Essex County with nearby schools including Saltonstall School, Horace Mann Laboratory, and Carlton Elementary School.
Ownership History
Date
Name
Owned For
Owner Type
Purchase Details
Closed on
May 28, 2010
Sold by
7 Savory Road Rt
Bought by
Wingard Brett L
Current Estimated Value
Home Financials for this Owner
Home Financials are based on the most recent Mortgage that was taken out on this home.
Original Mortgage
$355,216
Interest Rate
5.13%
Mortgage Type
Purchase Money Mortgage
Create a Home Valuation Report for This Property
The Home Valuation Report is an in-depth analysis detailing your home's value as well as a comparison with similar homes in the area
Home Values in the Area
Average Home Value in this Area
Purchase History
| Date | Buyer | Sale Price | Title Company |
|---|---|---|---|
| Wingard Brett L | $360,000 | -- |
Source: Public Records
Mortgage History
| Date | Status | Borrower | Loan Amount |
|---|---|---|---|
| Open | Wingard Brett L | $250,000 | |
| Closed | Wingard Brett L | $339,000 | |
| Closed | Wingard Brett L | $353,500 | |
| Closed | Wingard Brett L | $355,216 |
Source: Public Records
Tax History Compared to Growth
Tax History
| Year | Tax Paid | Tax Assessment Tax Assessment Total Assessment is a certain percentage of the fair market value that is determined by local assessors to be the total taxable value of land and additions on the property. | Land | Improvement |
|---|---|---|---|---|
| 2025 | $8,277 | $729,900 | $280,500 | $449,400 |
| 2024 | $8,006 | $689,000 | $260,500 | $428,500 |
| 2023 | $7,664 | $612,600 | $240,500 | $372,100 |
| 2022 | $7,419 | $559,900 | $227,100 | $332,800 |
| 2021 | $7,651 | $554,400 | $227,100 | $327,300 |
| 2020 | $7,657 | $529,900 | $227,100 | $302,800 |
| 2019 | $6,973 | $461,800 | $220,400 | $241,400 |
| 2018 | $6,783 | $441,000 | $210,400 | $230,600 |
| 2017 | $6,222 | $392,300 | $190,400 | $201,900 |
| 2016 | $6,147 | $392,300 | $190,400 | $201,900 |
| 2015 | $6,045 | $368,400 | $177,000 | $191,400 |
Source: Public Records
Map
Nearby Homes
- 327 Lafayette St Unit 2
- 3 Wisteria St Unit 1
- 106 Broadway Unit 3
- 106 Broadway Unit 1
- 71 Ocean Ave Unit 3
- 275 Lafayette St
- 20 Willow Ave Unit 1
- 256 Lafayette St Unit 3
- 17 Messervy St Unit 1
- 393 Jefferson Ave
- 232 Lafayette St
- 39 Leach St Unit 1
- 5 Sunset Rd
- 73 Lawrence St
- 25 Roslyn St Unit 3
- 2A Hazel St Unit 3
- 163 Ocean Ave W Unit W
- 263 Jefferson Ave
- 209 Jefferson Ave
- 9 Fillmore Rd Unit 9C