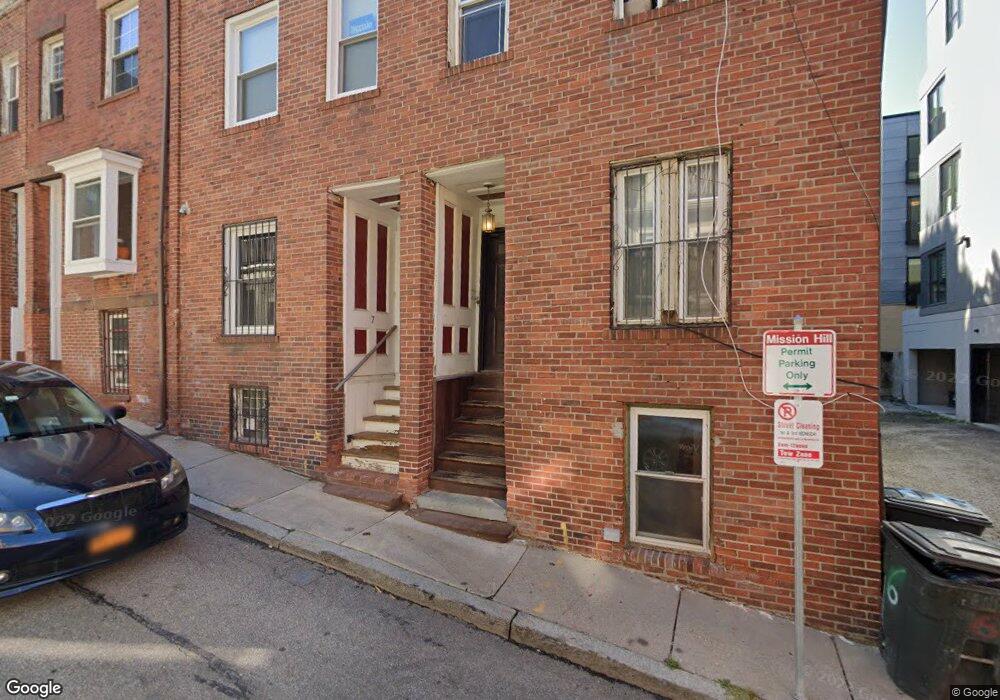
7 Sewall St Roxbury Crossing, MA 02120
Mission Hill NeighborhoodEstimated Value: $760,567 - $1,079,000
About This Home
This home is located at 7 Sewall St, Roxbury Crossing, MA 02120 and is currently estimated at $868,142, approximately $482 per square foot. 7 Sewall St is a home located in Suffolk County with nearby schools including Malik Academy and Manville School.
Ownership History
We collect this data history from publicly available records. To have your information removed, we recommend requesting removal directly through your county’s website.
Purchase Details
Purchase Details
Home Values in the Area
Average Home Value in this Area
Purchase History
We collect this data history from publicly available records. To have your information removed, we recommend requesting removal directly through your county’s website.
| Date | Buyer | Sale Price | Title Company |
|---|---|---|---|
| -- | None Available | ||
| -- | None Available | ||
| $10,000 | -- | ||
| $10,000 | -- |
Mortgage History
We collect this data history from publicly available records. To have your information removed, we recommend requesting removal directly through your county’s website.
| Date | Status | Borrower | Loan Amount |
|---|---|---|---|
| Previous Owner | $264,000 | ||
| Previous Owner | $89,000 | ||
| Previous Owner | $65,000 |
Tax History
We collect this data history from publicly available records. To have your information removed, we recommend requesting removal directly through your county’s website.
| Year | Tax Paid | Tax Assessment Tax Assessment Total Assessment is a certain percentage of the fair market value that is determined by local assessors to be the total taxable value of land and additions on the property. | Land | Improvement |
|---|---|---|---|---|
| 2025 | $7,616 | $657,700 | $208,800 | $448,900 |
| 2024 | $7,146 | $655,600 | $240,000 | $415,600 |
| 2023 | $6,900 | $642,500 | $240,000 | $402,500 |
| 2022 | $6,990 | $642,500 | $240,000 | $402,500 |
| 2021 | $6,656 | $623,800 | $233,000 | $390,800 |
| 2020 | $5,491 | $520,000 | $210,000 | $310,000 |
| 2019 | $5,218 | $495,100 | $172,800 | $322,300 |
| 2018 | $4,942 | $471,600 | $172,800 | $298,800 |
| 2017 | $4,849 | $457,900 | $172,800 | $285,100 |
| 2016 | $4,539 | $412,600 | $172,800 | $239,800 |
| 2015 | $4,541 | $375,000 | $163,100 | $211,900 |
| 2014 | $4,368 | $347,200 | $163,100 | $184,100 |
Map
- 34 Alleghany St
- 36 Alleghany St
- 80 Terrace St Unit 501
- 23 Hillside St
- 134 Terrace St
- 164 Calumet St
- 841 Parker St Unit 203
- 841 Parker St Unit 101
- 3 S Whitney St Unit 4
- 31 Worthington St
- 78 Fort Ave Unit 78
- 52 Fisher Ave Unit 302
- 19-21 Norfolk St Unit 1
- 45 Lawn St
- 27 Guild St Unit 301
- 27 Guild St Unit 106
- 63 Beech Glen St
- 10-12 Rockledge St
- 12 Schiller St
- 39 Hawthorne St Unit 39
- 737 Parker St Unit 3
- 737 Parker St
- 737 Parker St
- 737 Parker St Unit 1
- 737 Parker St Unit 2
- 735 Parker St
- 735 Parker St Unit 2
- 735 Parker St
- 735 Parker St Unit 1
- 735 Parker St Unit 3
- 739 Parker St Unit 2
- 739 Parker St Unit 1
- 739 Parker St Unit 5
- 739 Parker St
- 739 Parker St Unit 3
- 739 Parker St Unit 741
- 733 Parker St
- 733 Parker St Unit 202
- 733 Parker St Unit 733 Parker
- 733 Parker St Unit 733 Parker St
Ask me questions while you tour the home.