T
Seller's Agent in 2020
Tommy Connors
Redfin Corp.
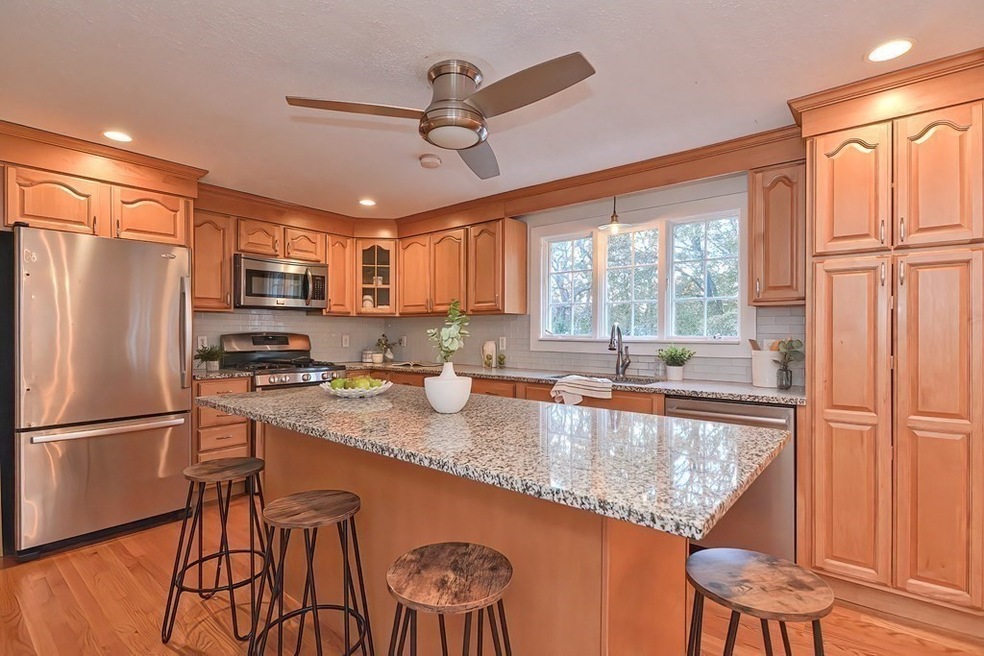
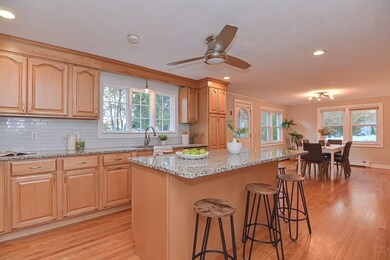
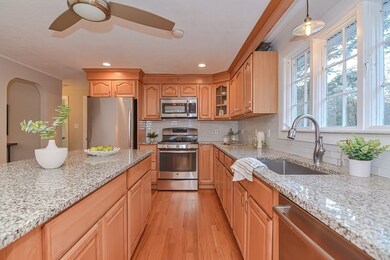


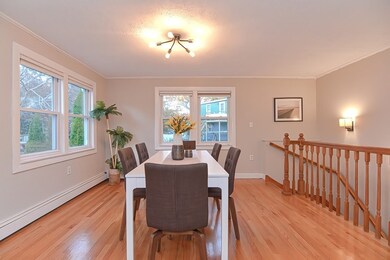
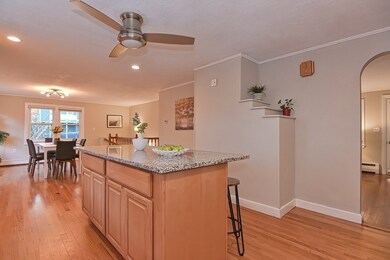
Wow! Do not miss this one, previous buyers' loss is your gain! You'll not only be home for the holidays, but the star host as well w/ a sprawling floorplan & plenty of space for guests, entertaining, & extended family (excellent in-law potential!). Ideally located on the West Side w easy access to 95, Rt 3 & 93, this freshly painted gem is ready for new occupants to enjoy its bright & airy layout! The heart of this home is the open kitchen & dining area. Chefs will appreciate the large granite island and countertops, ample solid wood cabinetry, & a full suite of s/s appliances. Cozy up & unwind in the fireplaced living room. All BRs well-sized w/ 2 exposures & built out closets. Fresh, modern tiled bathroom. Gigantic walk-out lower level is a true swiss army knife of open concept space (WFH, gym, media/play room), full bath, & separate bedroom. Fenced in yard. Convenience, endless retail/dining options, low taxes, Horn Pond, & SO much more make Woburn one of the best places to live!
Last Agent to Sell the Property
Tommy Connors
Redfin Corp. Listed on: 10/08/2020

| Date | Type | Sale Price | Title Company |
|---|---|---|---|
| Quit Claim Deed | -- | None Available | |
| Quit Claim Deed | -- | None Available | |
| Foreclosure Deed | $244,274 | -- | |
| Foreclosure Deed | $244,274 | -- | |
| Deed | $355,000 | -- | |
| Deed | $355,000 | -- | |
| Deed | $18,500 | -- | |
| Deed | $2,000 | -- |
| Date | Status | Loan Amount | Loan Type |
|---|---|---|---|
| Previous Owner | $274,400 | Adjustable Rate Mortgage/ARM | |
| Previous Owner | $265,422 | Purchase Money Mortgage |
| Date | Event | Price | Change | Sq Ft Price |
|---|---|---|---|---|
| 12/22/2020 12/22/20 | Sold | $635,000 | +2.4% | $272 / Sq Ft |
| 11/10/2020 11/10/20 | Pending | -- | -- | -- |
| 11/06/2020 11/06/20 | For Sale | $620,000 | -2.4% | $265 / Sq Ft |
| 11/05/2020 11/05/20 | Off Market | $635,000 | -- | -- |
| 11/02/2020 11/02/20 | Price Changed | $620,000 | -2.4% | $265 / Sq Ft |
| 10/20/2020 10/20/20 | For Sale | $635,000 | 0.0% | $272 / Sq Ft |
| 10/15/2020 10/15/20 | Pending | -- | -- | -- |
| 10/08/2020 10/08/20 | For Sale | $635,000 | +5.9% | $272 / Sq Ft |
| 07/19/2019 07/19/19 | Sold | $599,900 | 0.0% | $257 / Sq Ft |
| 06/19/2019 06/19/19 | Pending | -- | -- | -- |
| 06/14/2019 06/14/19 | For Sale | $599,900 | +53.0% | $257 / Sq Ft |
| 09/11/2014 09/11/14 | Sold | $392,000 | 0.0% | $187 / Sq Ft |
| 08/12/2014 08/12/14 | Pending | -- | -- | -- |
| 07/22/2014 07/22/14 | Off Market | $392,000 | -- | -- |
| 07/17/2014 07/17/14 | For Sale | $379,900 | +21.4% | $182 / Sq Ft |
| 02/09/2012 02/09/12 | Sold | $312,900 | -0.6% | $225 / Sq Ft |
| 12/23/2011 12/23/11 | Pending | -- | -- | -- |
| 12/07/2011 12/07/11 | For Sale | $314,900 | -- | $227 / Sq Ft |
| Year | Tax Paid | Tax Assessment Tax Assessment Total Assessment is a certain percentage of the fair market value that is determined by local assessors to be the total taxable value of land and additions on the property. | Land | Improvement |
|---|---|---|---|---|
| 2025 | $5,965 | $698,500 | $330,100 | $368,400 |
| 2024 | $5,503 | $682,800 | $314,400 | $368,400 |
| 2023 | $5,584 | $641,800 | $285,800 | $356,000 |
| 2022 | $5,521 | $591,100 | $248,500 | $342,600 |
| 2021 | $4,811 | $515,600 | $236,700 | $278,900 |
| 2020 | $4,210 | $451,700 | $236,700 | $215,000 |
| 2019 | $4,028 | $424,000 | $225,400 | $198,600 |
| 2018 | $3,840 | $388,300 | $206,800 | $181,500 |
| 2017 | $3,733 | $375,600 | $197,000 | $178,600 |
| 2016 | $3,561 | $354,300 | $184,100 | $170,200 |
| 2015 | $3,424 | $336,700 | $172,000 | $164,700 |
| 2014 | $3,202 | $306,700 | $172,000 | $134,700 |
T
Seller's Agent in 2020
Tommy Connors
Redfin Corp.
Buyer's Agent in 2020
Christopher Miller
Conway - Hingham
(617) 285-5872
1 in this area
69 Total Sales
Seller's Agent in 2019
Joanne Mulkerin
J. Mulkerin Realty
(781) 933-7200
17 in this area
150 Total Sales
E
Buyer's Agent in 2019
Elizabeth Foley
Lamacchia Realty, Inc.
N
Seller's Agent in 2014
Nancy McLaughlin
Redfin Corp.
K
Seller's Agent in 2012
Kieran Brosnan
Brosnan Realty Group, Inc.
(617) 212-1315
8 Total Sales
Source: MLS Property Information Network (MLS PIN)
MLS Number: 72739738
APN: WOBU-000034-000006-000002
Disclaimer: Certain information contained herein is derived from information provided by parties other than Homes.com. All information provided is deemed reliable, but is not guaranteed to be accurate and should be independently verified.
![]() The property listing data and information, or the Images, set forth herein were provided to MLS Property Information Network, Inc. from third party sources, including sellers, lessors and public records, and were compiled by MLS Property Information Network, Inc. The property listing data and information, and the Images, are for the personal, non-commercial use of consumers having a good faith interest in purchasing or leasing listed properties of the type displayed to them and may not be used for any purpose other than to identify prospective properties which such consumers may have a good faith interest in purchasing or leasing. MLS Property Information Network, Inc. and its subscribers disclaim any and all representations and warranties as to the accuracy of the property listing data and information, or as to the accuracy of any of the Images, set forth herein.
The property listing data and information, or the Images, set forth herein were provided to MLS Property Information Network, Inc. from third party sources, including sellers, lessors and public records, and were compiled by MLS Property Information Network, Inc. The property listing data and information, and the Images, are for the personal, non-commercial use of consumers having a good faith interest in purchasing or leasing listed properties of the type displayed to them and may not be used for any purpose other than to identify prospective properties which such consumers may have a good faith interest in purchasing or leasing. MLS Property Information Network, Inc. and its subscribers disclaim any and all representations and warranties as to the accuracy of the property listing data and information, or as to the accuracy of any of the Images, set forth herein.