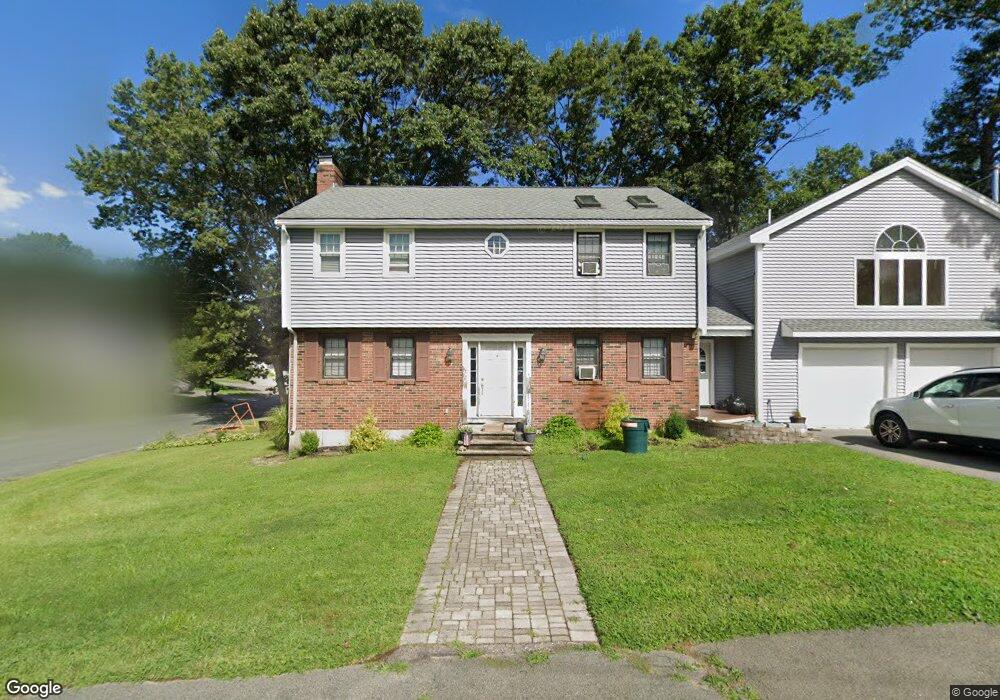
7 Skyview Rd Woburn, MA 01801
Downtown Woburn NeighborhoodEstimated Value: $820,000 - $971,000
3
Beds
3
Baths
1,908
Sq Ft
$468/Sq Ft
Est. Value
About This Home
This home is located at 7 Skyview Rd, Woburn, MA 01801 and is currently estimated at $892,606, approximately $467 per square foot. 7 Skyview Rd is a home located in Middlesex County with nearby schools including Shamrock Elementary School, Daniel L. Joyce Middle School, and Woburn High School.
Ownership History
Date
Name
Owned For
Owner Type
Purchase Details
Closed on
Jul 15, 2005
Sold by
Spry Monica L
Bought by
Curll Kerri A and Curll Kevin R
Current Estimated Value
Home Financials for this Owner
Home Financials are based on the most recent Mortgage that was taken out on this home.
Original Mortgage
$359,650
Outstanding Balance
$185,471
Interest Rate
5.67%
Mortgage Type
Purchase Money Mortgage
Estimated Equity
$707,135
Create a Home Valuation Report for This Property
The Home Valuation Report is an in-depth analysis detailing your home's value as well as a comparison with similar homes in the area
Home Values in the Area
Average Home Value in this Area
Purchase History
| Date | Buyer | Sale Price | Title Company |
|---|---|---|---|
| Curll Kerri A | $449,750 | -- | |
| Curll Kerri A | $449,750 | -- |
Source: Public Records
Mortgage History
| Date | Status | Borrower | Loan Amount |
|---|---|---|---|
| Open | Curll Kerri A | $359,650 | |
| Closed | Curll Kerri A | $359,650 |
Source: Public Records
Tax History
| Year | Tax Paid | Tax Assessment Tax Assessment Total Assessment is a certain percentage of the fair market value that is determined by local assessors to be the total taxable value of land and additions on the property. | Land | Improvement |
|---|---|---|---|---|
| 2025 | $7,290 | $853,600 | $368,800 | $484,800 |
| 2024 | $6,553 | $813,000 | $351,300 | $461,700 |
| 2023 | $6,394 | $734,900 | $319,400 | $415,500 |
| 2022 | $6,329 | $677,600 | $277,900 | $399,700 |
| 2021 | $6,794 | $651,500 | $264,700 | $386,800 |
| 2020 | $5,851 | $627,800 | $264,700 | $363,100 |
| 2019 | $5,657 | $595,500 | $252,100 | $343,400 |
| 2018 | $5,434 | $549,400 | $231,400 | $318,000 |
| 2017 | $5,114 | $514,500 | $220,400 | $294,100 |
| 2016 | $4,891 | $486,700 | $206,100 | $280,600 |
| 2015 | $4,721 | $464,200 | $192,600 | $271,600 |
| 2014 | $4,572 | $437,900 | $192,600 | $245,300 |
Source: Public Records
Map
Nearby Homes
- 64A Mount Pleasant St
- 28 Arlington St
- 0 Mount Pleasant St
- 14 Garfield Ave
- 7 Conant Rd Unit 33
- 21 Eastern Ave
- 230 Main St Unit 4
- 35 Prospect St Unit 215
- 6 Porter St
- 8 Russell Rd Unit 10
- 171 Swanton St Unit 73
- 35 Montvale Ave Unit 8
- 7 Prospect St
- 20 Arthur St
- 95 Irving St
- 237 Swanton St
- 15 Sturgis St
- 136 Sylvester Ave
- 477 Main St
- 52 Pleasant St
- 5 Skyview Rd
- 19 Blueberry Hill Rd
- 19 Blueberry Hill Rd Unit SF
- 56 Leonard St
- 53 Leonard St
- 10 Skyview Rd
- 21 Blueberry Hill Rd
- 17 Blueberry Hill Rd
- 3 Skyview Rd
- 55 Leonard St
- 8 Skyview Rd
- 20 Blueberry Hill Rd
- 23 Blueberry Hill Rd
- 2 Bradford Rd
- 57 Leonard St
- 6 Skyview Rd
- 4 Skyview Ln
- 4 Bradford Rd
- 4 Bradford Rd
- 4 Bradford Rd Unit 1