7 South St Fairhaven, MA 02719
Estimated Value: $340,000 - $529,379
3
Beds
2
Baths
901
Sq Ft
$489/Sq Ft
Est. Value
About This Home
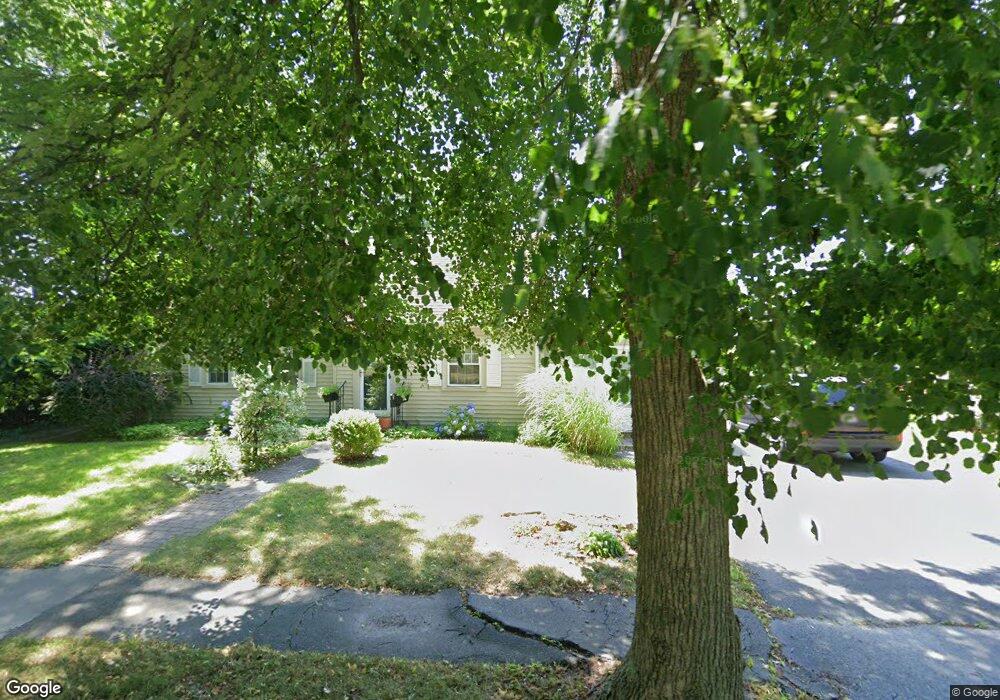
This home is located at 7 South St, Fairhaven, MA 02719 and is currently estimated at $440,845, approximately $489 per square foot. 7 South St is a home located in Bristol County with nearby schools including Fairhaven High School, City On A Hill Charter Public School New Bedford, and St. Joseph School.
Ownership History
Date
Name
Owned For
Owner Type
Purchase Details
Closed on
Jun 24, 2025
Sold by
Taylor Lorraine M
Bought by
Taylor Lorraine M and Taylor Adam
Current Estimated Value
Purchase Details
Closed on
Nov 5, 2024
Sold by
Taylor Lt and Taylor
Bought by
Taylor Lorraine M
Purchase Details
Closed on
Dec 18, 2018
Sold by
Taylor James E and Taylor Lorraine M
Bought by
Taylor Lt and Taylor
Purchase Details
Closed on
Aug 28, 1985
Bought by
Taylor James E and Taylor Lorraine M
Create a Home Valuation Report for This Property
The Home Valuation Report is an in-depth analysis detailing your home's value as well as a comparison with similar homes in the area
Home Values in the Area
Average Home Value in this Area
Purchase History
| Date | Buyer | Sale Price | Title Company |
|---|---|---|---|
| Taylor Lorraine M | -- | -- | |
| Taylor Lorraine M | -- | -- | |
| Taylor Lorraine M | -- | -- | |
| Taylor Lorraine M | -- | None Available | |
| Taylor Lorraine M | -- | None Available | |
| Taylor Lorraine M | -- | None Available | |
| Taylor Lt | -- | -- | |
| Taylor Lt | -- | -- | |
| Taylor Lt | -- | -- | |
| Taylor James E | $71,500 | -- |
Source: Public Records
Mortgage History
| Date | Status | Borrower | Loan Amount |
|---|---|---|---|
| Previous Owner | Taylor James E | $149,000 | |
| Previous Owner | Taylor James E | $15,000 | |
| Previous Owner | Taylor James E | $60,000 |
Source: Public Records
Tax History Compared to Growth
Tax History
| Year | Tax Paid | Tax Assessment Tax Assessment Total Assessment is a certain percentage of the fair market value that is determined by local assessors to be the total taxable value of land and additions on the property. | Land | Improvement |
|---|---|---|---|---|
| 2025 | $4,253 | $456,300 | $241,700 | $214,600 |
| 2024 | $4,094 | $443,600 | $241,700 | $201,900 |
| 2023 | $3,679 | $369,700 | $208,500 | $161,200 |
| 2022 | $3,516 | $344,000 | $189,900 | $154,100 |
| 2021 | $3,446 | $305,200 | $172,700 | $132,500 |
| 2020 | $3,376 | $305,200 | $172,700 | $132,500 |
| 2019 | $3,210 | $275,100 | $148,000 | $127,100 |
| 2018 | $3,084 | $262,500 | $140,800 | $121,700 |
| 2017 | $2,999 | $249,100 | $135,500 | $113,600 |
| 2016 | $2,968 | $243,700 | $132,800 | $110,900 |
| 2015 | $2,858 | $235,200 | $132,800 | $102,400 |
Source: Public Records
Map
Nearby Homes