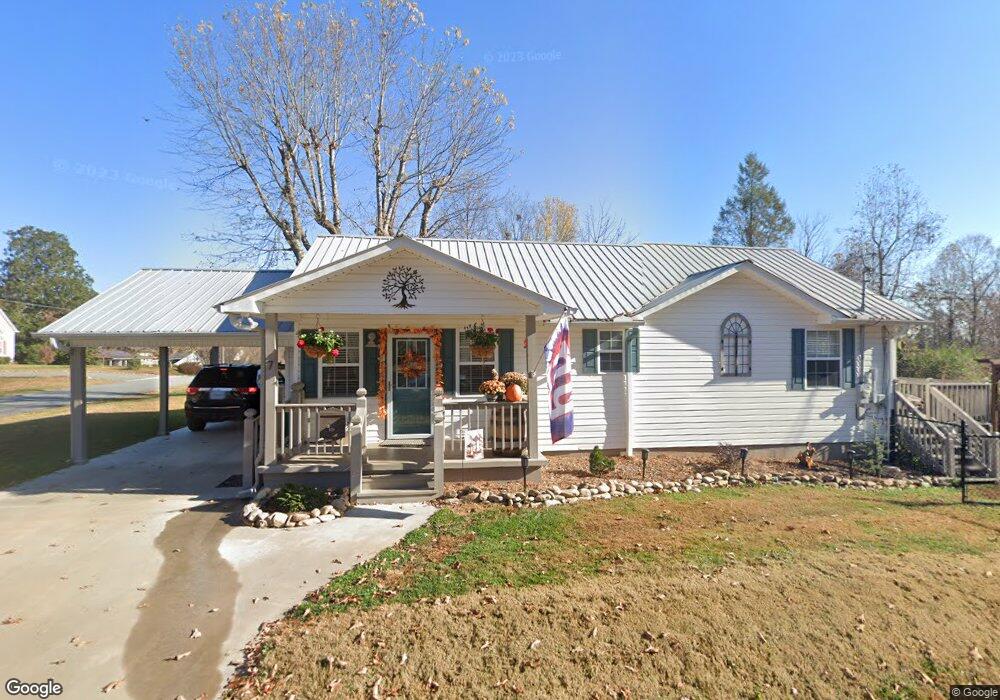
7 Summit St Blue Ridge, FL 30513
Estimated Value: $372,000 - $467,223
2
Beds
2
Baths
1,050
Sq Ft
$395/Sq Ft
Est. Value
About This Home
This home is located at 7 Summit St, Blue Ridge, FL 30513 and is currently estimated at $414,556, approximately $394 per square foot. 7 Summit St is a home located in Fannin County with nearby schools including Fannin County High School and Fannin Christian Learning Center.
Ownership History
Date
Name
Owned For
Owner Type
Purchase Details
Closed on
Jan 20, 2023
Sold by
Pearce Diane
Bought by
Pearce Diane and Pearce Robert
Current Estimated Value
Home Financials for this Owner
Home Financials are based on the most recent Mortgage that was taken out on this home.
Original Mortgage
$310,000
Outstanding Balance
$299,129
Interest Rate
6.27%
Mortgage Type
New Conventional
Estimated Equity
$115,427
Purchase Details
Closed on
Jun 4, 2018
Sold by
Curlee Shelby D
Bought by
Bell Jeffrey Lynn and Bell Margaret Lowry
Purchase Details
Closed on
Dec 1, 2016
Sold by
Barbara L
Bought by
Lamm Barbara L and Curlee Shelby D
Purchase Details
Closed on
May 20, 1997
Sold by
Fisher Clifford Lero
Bought by
Lamm Barbara L
Purchase Details
Closed on
Jan 28, 1994
Bought by
Fisher Clifford Lero
Purchase Details
Closed on
Mar 16, 1992
Bought by
Fisher David F and Fisher Tal
Purchase Details
Closed on
Apr 30, 1987
Bought by
Plucinski Michael Et
Create a Home Valuation Report for This Property
The Home Valuation Report is an in-depth analysis detailing your home's value as well as a comparison with similar homes in the area
Home Values in the Area
Average Home Value in this Area
Purchase History
We collect this data history from publicly available records. To have your information removed, we recommend requesting removal directly through your county’s website.
| Date | Buyer | Sale Price | Title Company |
|---|---|---|---|
| Pearce Diane | -- | -- | |
| Pearce Diane | $395,000 | -- | |
| Bell Jeffrey Lynn | $200,000 | -- | |
| Lamm Barbara L | -- | -- | |
| Lamm Barbara L | $40,000 | -- | |
| Fisher Clifford Lero | $4,500 | -- | |
| Fisher David F | $14,900 | -- | |
| Plucinski Michael Et | -- | -- |
Source: Public Records
Mortgage History
We collect this data history from publicly available records. To have your information removed, we recommend requesting removal directly through your county’s website.
| Date | Status | Borrower | Loan Amount |
|---|---|---|---|
| Open | Pearce Diane | $310,000 |
Source: Public Records
Tax History
| Year | Tax Paid | Tax Assessment Tax Assessment Total Assessment is a certain percentage of the fair market value that is determined by local assessors to be the total taxable value of land and additions on the property. | Land | Improvement |
|---|---|---|---|---|
| 2025 | $1,595 | $129,242 | $24,000 | $105,242 |
| 2024 | $11 | $132,242 | $27,000 | $105,242 |
| 2023 | $1,523 | $106,932 | $20,450 | $86,482 |
| 2022 | $1,101 | $108,043 | $20,450 | $87,593 |
| 2021 | $730 | $52,084 | $14,800 | $37,284 |
| 2020 | $657 | $46,084 | $8,800 | $37,284 |
| 2019 | $670 | $46,084 | $8,800 | $37,284 |
| 2018 | $99 | $51,300 | $8,800 | $42,500 |
| 2017 | $1,212 | $52,300 | $8,800 | $43,500 |
| 2016 | $100 | $41,829 | $8,800 | $33,029 |
| 2015 | $104 | $42,222 | $8,800 | $33,422 |
| 2014 | $104 | $40,044 | $4,200 | $35,844 |
| 2013 | -- | $33,625 | $4,200 | $29,425 |
Source: Public Records
Map
Nearby Homes
- 0 W Church St
- Lot 2 Ridges of Blue Ridge
- 190 Mckinney St
- 1 E Main St
- Na
- 280 Pointe of View
- 42 Rolling Rapids
- 2 & 2A Weymans Way
- 306 Jacks River Rd
- Lot 12 The Heights
- Unit 2 Grove Loop
- 280 Pointe of View Unit 15
- 1133 E Main St
- 742 E 2nd St
- .90 acre E Highland St
- 117 Milam St
- 116 W Main St
- 116 W Main St Unit STE 2A
- 116 W Main St Unit 2A
- 167 Cohutta Sunset Dr
- 7 Summit St
- 155 College St
- 16 Summit St
- LOT 2 College St
- 0 College St Unit 166737
- 504 W Second St
- 131 College St
- 40 Summit St
- 218 College St
- 126 College St
- 115 College St
- 243 College St
- 66 Summit St
- 65 Summit St
- 24 Church St
- 142 College St
- 473 W Second St
- 225 College St
- 10 Church St
- 0 Chapel Terrace Unit 13 7536979
Your Personal Tour Guide
Ask me questions while you tour the home.