7 Surf St Unit May 27, 2023-Septemb Sea Bright, NJ 07760
Sea Bright NeighborhoodEstimated Value: $492,000 - $933,000
1
Bed
1
Bath
596
Sq Ft
$1,076/Sq Ft
Est. Value
About This Home
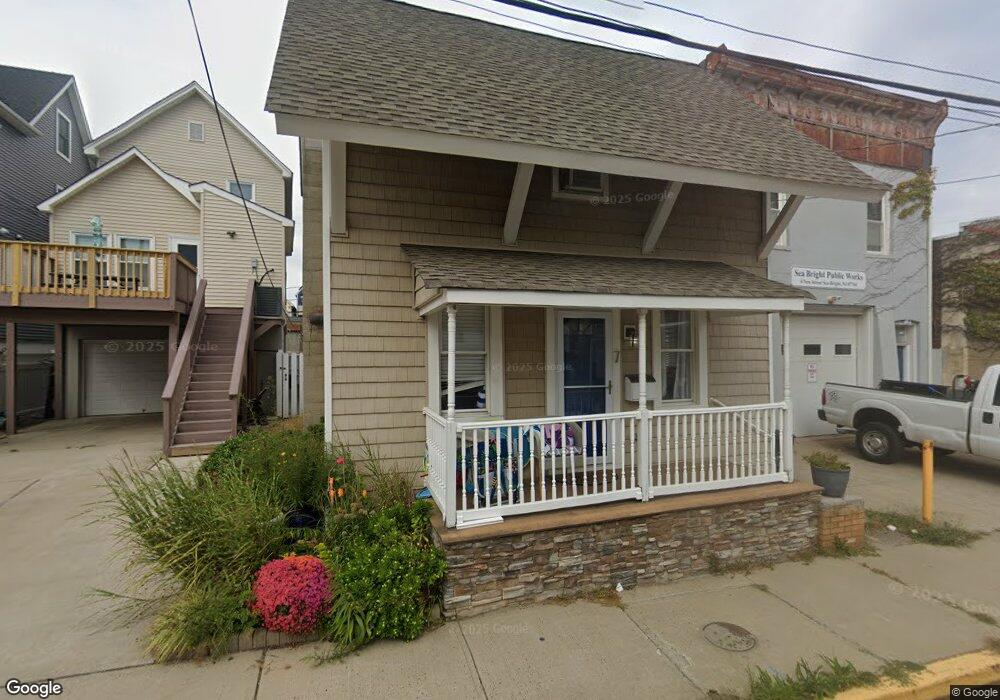
This home is located at 7 Surf St Unit May 27, 2023-Septemb, Sea Bright, NJ 07760 and is currently estimated at $641,347, approximately $1,076 per square foot. 7 Surf St Unit May 27, 2023-Septemb is a home located in Monmouth County with nearby schools including Wolf Hill Elementary School, Maple Place Elementary and Middle School, and Shore Regional High School.
Ownership History
Date
Name
Owned For
Owner Type
Purchase Details
Closed on
Apr 10, 2017
Sold by
Beer Joanathan H and Cannon George D
Bought by
Langevin Carmine
Current Estimated Value
Home Financials for this Owner
Home Financials are based on the most recent Mortgage that was taken out on this home.
Original Mortgage
$232,000
Outstanding Balance
$192,475
Interest Rate
4.1%
Mortgage Type
New Conventional
Estimated Equity
$448,872
Purchase Details
Closed on
Sep 27, 2016
Sold by
Puso Jack R and Horowitz Seth
Bought by
Beer Jonathan and Cannon George D
Purchase Details
Closed on
Aug 9, 2013
Sold by
Miller Patricia
Bought by
Puso Jack and Horowitz Seth
Home Financials for this Owner
Home Financials are based on the most recent Mortgage that was taken out on this home.
Original Mortgage
$90,930
Interest Rate
4.51%
Mortgage Type
Purchase Money Mortgage
Create a Home Valuation Report for This Property
The Home Valuation Report is an in-depth analysis detailing your home's value as well as a comparison with similar homes in the area
Home Values in the Area
Average Home Value in this Area
Purchase History
| Date | Buyer | Sale Price | Title Company |
|---|---|---|---|
| Langevin Carmine | $290,000 | None Available | |
| Beer Jonathan | $174,250 | None Available | |
| Puso Jack | $69,000 | North American Title Co |
Source: Public Records
Mortgage History
| Date | Status | Borrower | Loan Amount |
|---|---|---|---|
| Open | Langevin Carmine | $232,000 | |
| Previous Owner | Puso Jack | $90,930 |
Source: Public Records
Tax History Compared to Growth
Tax History
| Year | Tax Paid | Tax Assessment Tax Assessment Total Assessment is a certain percentage of the fair market value that is determined by local assessors to be the total taxable value of land and additions on the property. | Land | Improvement |
|---|---|---|---|---|
| 2025 | $4,987 | $612,200 | $490,900 | $121,300 |
| 2024 | $4,219 | $521,700 | $408,400 | $113,300 |
| 2023 | $4,219 | $412,000 | $314,600 | $97,400 |
| 2022 | $3,813 | $363,300 | $269,600 | $93,700 |
| 2021 | $3,813 | $306,300 | $214,700 | $91,600 |
| 2020 | $3,500 | $272,600 | $184,700 | $87,900 |
| 2019 | $2,892 | $213,100 | $129,800 | $83,300 |
| 2018 | $2,285 | $159,100 | $99,900 | $59,200 |
| 2017 | $1,990 | $136,400 | $77,400 | $59,000 |
| 2016 | $1,082 | $82,900 | $69,900 | $13,000 |
| 2015 | $1,687 | $84,100 | $56,800 | $27,300 |
| 2014 | $2,099 | $105,100 | $74,000 | $31,100 |
Source: Public Records
Map
Nearby Homes
- 10 South St
- 11 South St
- 24 Surf St
- 1080 Ocean Ave Unit 402
- 1184 Ocean Ave Unit A3
- 24 Grant Ave
- 24 Warren St
- 2 Tradewinds Ln
- 1332 Ocean Ave Unit 5
- 1340 Ocean Ave Unit 27
- 1382 Ocean Ave Unit 17A
- 10 Imbrie Place
- 5 Island View Way Unit 3
- 1492 Ocean Ave Unit A3
- 129 Avenue of Two Rivers
- 14 Ridge Rd
- 1500 Ocean Ave
- 1566 Ocean Ave Unit 38
- 8 Black Point Horseshoe
- 93 Rumson Rd
- 7 Surf St
- 7 Surf St Unit 9/16/24-5/15/25 or A
- 7 Surf St Unit 6/1/23-9/4/23
- 7 Surf St Unit WINTER '22 & SUMMER
- 7 Surf St Unit WINTER 10/3/21-5/3/2
- 7 Surf St Unit FOR SEASON 5/28/21-9
- 8 New St
- 10 New St
- 12 New St
- 8 Surf St
- 8 Surf St Unit SPRING
- 8 Surf St Unit WINTER
- 4 Surf St
- 10 Surf St
- 12 Surf St
- 14 New St
- 14 New St Unit SUMMER
- 1136 Ocean Ave Unit 303
- 1136 Ocean Ave Unit 302
- 1136 Ocean Ave Unit 201