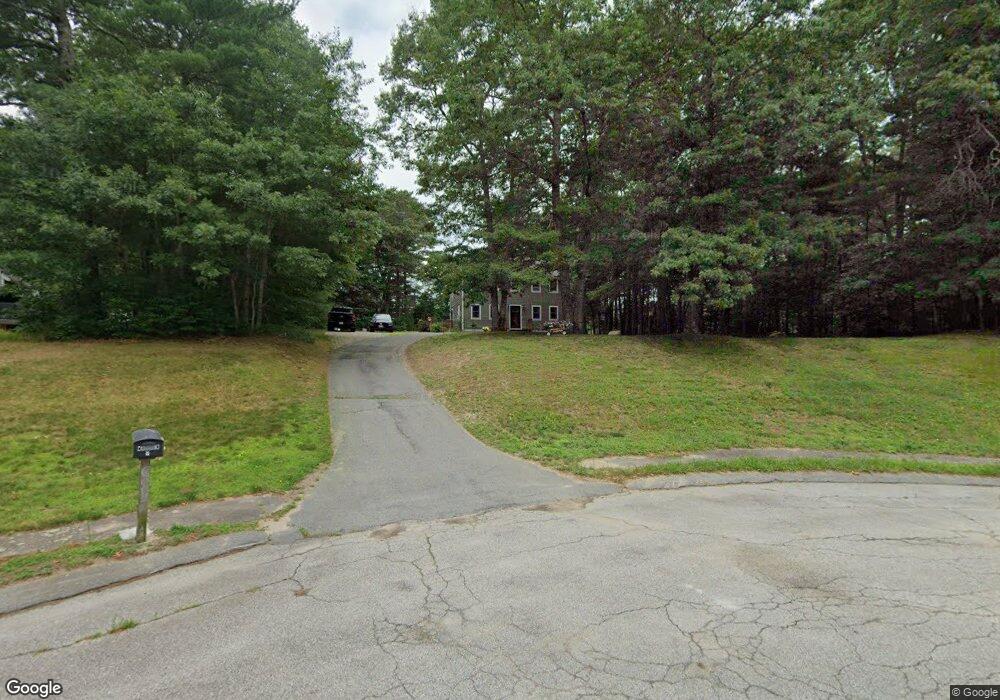
7 Susan Cir Carver, MA 02330
Estimated Value: $506,000 - $643,000
4
Beds
2
Baths
1,664
Sq Ft
$361/Sq Ft
Est. Value
About This Home
This home is located at 7 Susan Cir, Carver, MA 02330 and is currently estimated at $599,922, approximately $360 per square foot. 7 Susan Cir is a home located in Plymouth County with nearby schools including Carver Elementary School.
Ownership History
Date
Name
Owned For
Owner Type
Purchase Details
Closed on
May 25, 1990
Sold by
Myrtle St Rt
Bought by
Earle David E
Current Estimated Value
Purchase Details
Closed on
May 14, 1990
Sold by
Mcauliffe Andrew A
Bought by
Myrtle St Rt
Purchase Details
Closed on
Mar 9, 1990
Sold by
Mcauliffe Andrew A
Bought by
Myrtle St Rt
Purchase Details
Closed on
Dec 19, 1989
Sold by
111 Plymouth Bay Rt
Bought by
Mcauliffe Andrew A
Create a Home Valuation Report for This Property
The Home Valuation Report is an in-depth analysis detailing your home's value as well as a comparison with similar homes in the area
Home Values in the Area
Average Home Value in this Area
Purchase History
| Date | Buyer | Sale Price | Title Company |
|---|---|---|---|
| Earle David E | $142,000 | -- | |
| Myrtle St Rt | $119,000 | -- | |
| Myrtle St Rt | $119,000 | -- | |
| Mcauliffe Andrew A | $119,900 | -- |
Source: Public Records
Mortgage History
| Date | Status | Borrower | Loan Amount |
|---|---|---|---|
| Open | Mcauliffe Andrew A | $30,000 | |
| Open | Mcauliffe Andrew A | $100,000 | |
| Closed | Mcauliffe Andrew A | $25,000 |
Source: Public Records
Tax History Compared to Growth
Tax History
| Year | Tax Paid | Tax Assessment Tax Assessment Total Assessment is a certain percentage of the fair market value that is determined by local assessors to be the total taxable value of land and additions on the property. | Land | Improvement |
|---|---|---|---|---|
| 2025 | $6,924 | $499,200 | $161,900 | $337,300 |
| 2024 | $6,473 | $456,800 | $158,800 | $298,000 |
| 2023 | $6,315 | $432,800 | $158,800 | $274,000 |
| 2022 | $5,961 | $373,000 | $135,700 | $237,300 |
| 2021 | $5,729 | $338,200 | $121,200 | $217,000 |
| 2020 | $5,460 | $317,600 | $113,300 | $204,300 |
| 2019 | $5,309 | $311,400 | $110,000 | $201,400 |
| 2018 | $5,141 | $291,600 | $110,000 | $181,600 |
| 2017 | $4,962 | $280,500 | $105,800 | $174,700 |
| 2016 | $4,569 | $268,300 | $100,800 | $167,500 |
| 2015 | $4,480 | $263,400 | $100,800 | $162,600 |
| 2014 | $4,472 | $262,900 | $127,400 | $135,500 |
Source: Public Records
Map
Nearby Homes