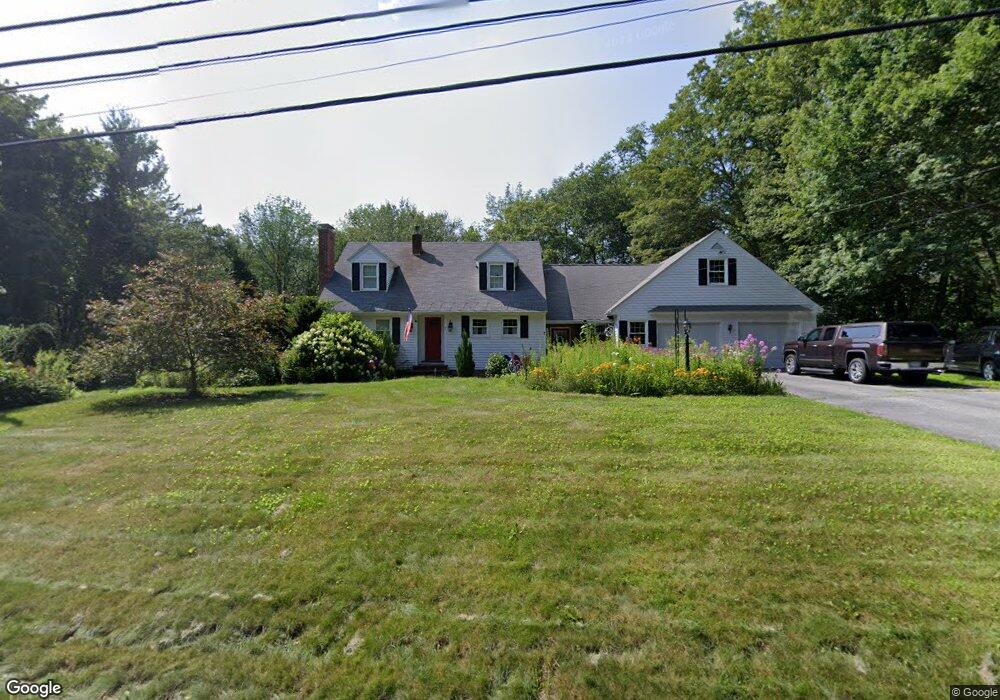
7 SW Main St East Douglas, MA 01516
Estimated Value: $452,000 - $493,000
3
Beds
2
Baths
1,741
Sq Ft
$275/Sq Ft
Est. Value
About This Home
This home is located at 7 SW Main St, East Douglas, MA 01516 and is currently estimated at $478,234, approximately $274 per square foot. 7 SW Main St is a home located in Worcester County with nearby schools including Douglas Primary School, Douglas Middle School, and Douglas High School.
Ownership History
Date
Name
Owned For
Owner Type
Purchase Details
Closed on
Mar 3, 2011
Sold by
Zygmuntowicz Andrew F and Zygmuntowicz Louise J
Bought by
Zygmuntowicz Tr Andrew F and Zygmuntowicz Louise J
Current Estimated Value
Purchase Details
Closed on
Dec 9, 2010
Sold by
Zygmuntowicz Andrew F and Zygmuntowicz Louise J
Bought by
Zygmuntowicz Tr Andrew F and Zygmuntowicz Louise J
Purchase Details
Closed on
Sep 8, 1966
Bought by
Zygmuntowicz Irt
Create a Home Valuation Report for This Property
The Home Valuation Report is an in-depth analysis detailing your home's value as well as a comparison with similar homes in the area
Home Values in the Area
Average Home Value in this Area
Purchase History
| Date | Buyer | Sale Price | Title Company |
|---|---|---|---|
| Zygmuntowicz Tr Andrew F | -- | -- | |
| Zygmuntowicz Tr Andrew F | -- | -- | |
| Zygmuntowicz Irt | -- | -- |
Source: Public Records
Mortgage History
| Date | Status | Borrower | Loan Amount |
|---|---|---|---|
| Previous Owner | Zygmuntowicz Irt | $35,000 | |
| Previous Owner | Zygmuntowicz Irt | $42,000 |
Source: Public Records
Tax History Compared to Growth
Tax History
| Year | Tax Paid | Tax Assessment Tax Assessment Total Assessment is a certain percentage of the fair market value that is determined by local assessors to be the total taxable value of land and additions on the property. | Land | Improvement |
|---|---|---|---|---|
| 2025 | $51 | $390,300 | $89,400 | $300,900 |
| 2024 | $5,121 | $378,800 | $81,300 | $297,500 |
| 2023 | $5,012 | $349,000 | $81,300 | $267,700 |
| 2022 | $5,105 | $312,400 | $75,100 | $237,300 |
| 2021 | $4,927 | $294,700 | $71,500 | $223,200 |
| 2020 | $4,792 | $282,200 | $71,500 | $210,700 |
| 2019 | $4,587 | $262,100 | $71,500 | $190,600 |
| 2018 | $4,091 | $254,600 | $71,500 | $183,100 |
| 2017 | $3,807 | $227,700 | $75,300 | $152,400 |
| 2016 | $3,709 | $220,500 | $75,300 | $145,200 |
| 2015 | $3,629 | $220,500 | $75,300 | $145,200 |
Source: Public Records
Map
Nearby Homes