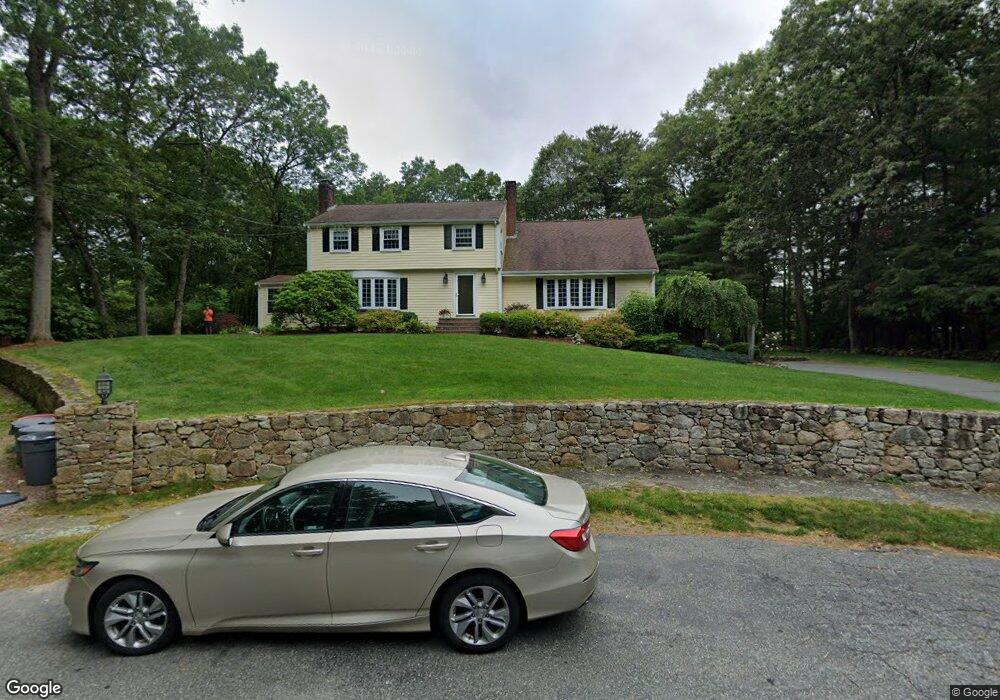
7 Tetreault Dr Walpole, MA 02081
Estimated Value: $1,020,671 - $1,335,000
5
Beds
3
Baths
2,800
Sq Ft
$426/Sq Ft
Est. Value
About This Home
This home is located at 7 Tetreault Dr, Walpole, MA 02081 and is currently estimated at $1,191,918, approximately $425 per square foot. 7 Tetreault Dr is a home located in Norfolk County with nearby schools including Fisher School, Walpole Middle School, and Walpole High School.
Ownership History
Date
Name
Owned For
Owner Type
Purchase Details
Closed on
Sep 24, 2003
Sold by
Coyne William J and Coyne Margaret E
Bought by
Bosse Peter L and Bosse Vikki J
Current Estimated Value
Home Financials for this Owner
Home Financials are based on the most recent Mortgage that was taken out on this home.
Original Mortgage
$492,000
Outstanding Balance
$229,024
Interest Rate
6.29%
Mortgage Type
Purchase Money Mortgage
Estimated Equity
$962,894
Purchase Details
Closed on
Oct 30, 2000
Sold by
Moore Frank H and Moore Margaret E
Bought by
Coyne William J
Home Financials for this Owner
Home Financials are based on the most recent Mortgage that was taken out on this home.
Original Mortgage
$368,000
Interest Rate
7.83%
Mortgage Type
Purchase Money Mortgage
Create a Home Valuation Report for This Property
The Home Valuation Report is an in-depth analysis detailing your home's value as well as a comparison with similar homes in the area
Home Values in the Area
Average Home Value in this Area
Purchase History
| Date | Buyer | Sale Price | Title Company |
|---|---|---|---|
| Bosse Peter L | $615,000 | -- | |
| Coyne William J | $460,000 | -- |
Source: Public Records
Mortgage History
| Date | Status | Borrower | Loan Amount |
|---|---|---|---|
| Open | Bosse Peter L | $492,000 | |
| Previous Owner | Coyne William J | $47,000 | |
| Previous Owner | Coyne William J | $368,000 | |
| Previous Owner | Coyne William J | $368,000 |
Source: Public Records
Tax History
| Year | Tax Paid | Tax Assessment Tax Assessment Total Assessment is a certain percentage of the fair market value that is determined by local assessors to be the total taxable value of land and additions on the property. | Land | Improvement |
|---|---|---|---|---|
| 2025 | $12,282 | $957,300 | $415,200 | $542,100 |
| 2024 | $11,890 | $899,400 | $399,300 | $500,100 |
| 2023 | $11,105 | $799,500 | $347,000 | $452,500 |
| 2022 | $10,291 | $711,700 | $321,100 | $390,600 |
| 2021 | $10,102 | $680,700 | $302,900 | $377,800 |
| 2020 | $9,708 | $647,600 | $285,800 | $361,800 |
| 2019 | $9,385 | $621,500 | $275,800 | $345,700 |
| 2018 | $9,148 | $599,100 | $262,900 | $336,200 |
| 2017 | $8,898 | $580,400 | $252,900 | $327,500 |
| 2016 | $8,682 | $558,000 | $245,800 | $312,200 |
| 2015 | $8,467 | $539,300 | $235,800 | $303,500 |
| 2014 | $8,239 | $522,800 | $235,800 | $287,000 |
Source: Public Records
Map
Nearby Homes
- 8 Mckinley Ave
- 241 Fisher St
- 38 Garden Pkwy
- 26 Albemarle Rd
- 19 and 23 Arlington Ln
- 291 Plimpton St
- 5 Endicott St Unit 3
- 26 Dover Dr
- 7 Tilton Ct Unit Ct
- 40 Endean Dr
- 70 Endicott St Unit 401
- 65 Alandale Pkwy
- 74 Alandale Pkwy
- 56 North St
- 53 Tremont St
- 100 Magnolia Dr
- 363 - 367 Washington St
- 7 Atwood Ave
- 111 Elm St
- 1086 Washington St
Your Personal Tour Guide
Ask me questions while you tour the home.