Estimated Value: $17,816 - $44,000
2
Beds
1
Bath
1,100
Sq Ft
$28/Sq Ft
Est. Value
About This Home
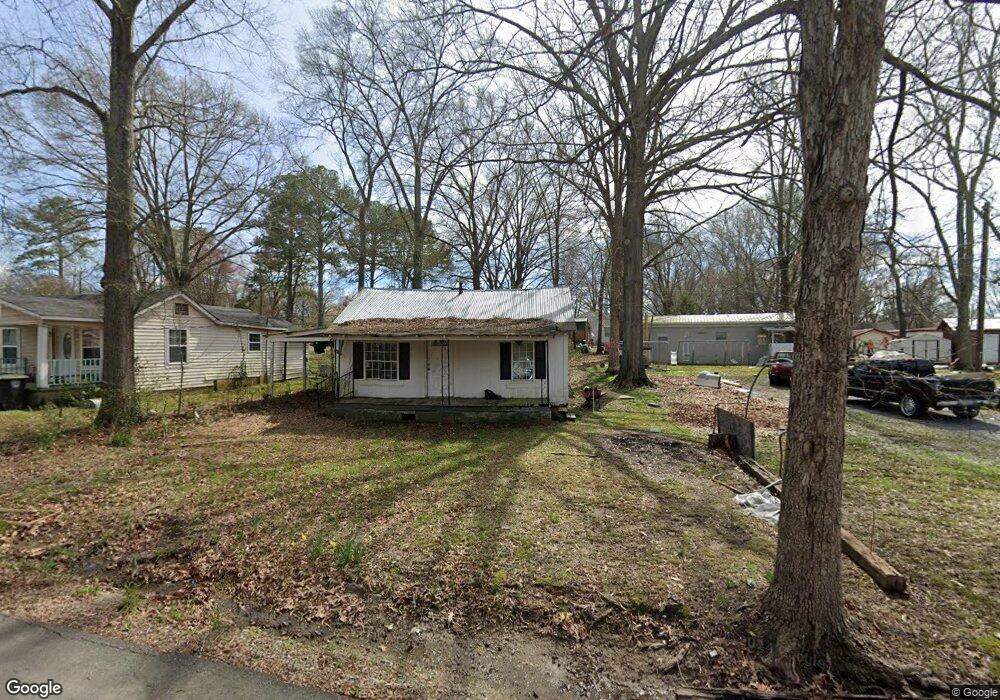
This home is located at 7 Texas Ave NW, Rome, GA 30165 and is currently estimated at $30,704, approximately $27 per square foot. 7 Texas Ave NW is a home located in Floyd County with nearby schools including Rome High School and St. Mary School.
Ownership History
Date
Name
Owned For
Owner Type
Purchase Details
Closed on
Mar 14, 2013
Sold by
Magnussen Joshua D
Bought by
Magnussen Joshua D Trustee
Current Estimated Value
Purchase Details
Closed on
Feb 9, 2013
Sold by
Weldon Randie
Bought by
Magnussen Joshua D
Purchase Details
Closed on
Sep 25, 2012
Sold by
Chapman Angela G
Bought by
Weldon Randie and Weldon Keith
Purchase Details
Closed on
Nov 14, 2011
Sold by
Federal National Mtg
Bought by
Chapman Angela
Purchase Details
Closed on
Sep 6, 2011
Sold by
Jpmorgan Chase Bank
Bought by
Federal National Mtg
Purchase Details
Closed on
May 16, 2003
Sold by
Samaraweera Kithmin
Bought by
Stroub Kenneth J and Stro Christine M
Purchase Details
Closed on
Mar 22, 2002
Sold by
Spain Hubert and Carolyn Frances Spain Mau
Bought by
Samaraweera Kithmin
Purchase Details
Closed on
Feb 18, 1999
Sold by
Spain Carrie M
Bought by
Spain Hubert and Carolyn Frances Spai
Purchase Details
Closed on
Dec 18, 1975
Sold by
Spain A L
Bought by
Spain Carrie M
Purchase Details
Closed on
Jan 1, 1901
Bought by
Spain A L
Create a Home Valuation Report for This Property
The Home Valuation Report is an in-depth analysis detailing your home's value as well as a comparison with similar homes in the area
Home Values in the Area
Average Home Value in this Area
Purchase History
| Date | Buyer | Sale Price | Title Company |
|---|---|---|---|
| Magnussen Joshua D Trustee | $100 | -- | |
| Magnussen Joshua D | $6,000 | -- | |
| Weldon Randie | $12,000 | -- | |
| Chapman Angela | $15,000 | -- | |
| Federal National Mtg | $9,000 | -- | |
| Jpmorgan Chase Bank | $9,000 | -- | |
| Stroub Kenneth J | $51,500 | -- | |
| Samaraweera Kithmin | $19,500 | -- | |
| Spain Hubert | -- | -- | |
| Spain Carrie M | -- | -- | |
| Spain A L | -- | -- |
Source: Public Records
Tax History Compared to Growth
Tax History
| Year | Tax Paid | Tax Assessment Tax Assessment Total Assessment is a certain percentage of the fair market value that is determined by local assessors to be the total taxable value of land and additions on the property. | Land | Improvement |
|---|---|---|---|---|
| 2024 | $671 | $18,945 | $4,400 | $14,545 |
| 2023 | $671 | $18,329 | $4,000 | $14,329 |
| 2022 | $678 | $18,577 | $3,200 | $15,377 |
| 2021 | $641 | $17,288 | $3,200 | $14,088 |
| 2020 | $605 | $16,176 | $2,500 | $13,676 |
| 2019 | $582 | $15,734 | $2,500 | $13,234 |
| 2018 | $560 | $15,129 | $2,500 | $12,629 |
| 2017 | $553 | $14,937 | $2,500 | $12,437 |
| 2016 | $550 | $14,816 | $2,480 | $12,336 |
| 2015 | $168 | $15,056 | $2,480 | $12,576 |
| 2014 | $168 | $15,296 | $2,480 | $12,816 |
Source: Public Records
Map
Nearby Homes
- 107 Kirton St NW
- 101 Garrard Ave NW
- 15 Alexander St
- 202 Ohio Dr NW
- 104 Dellwood Dr NW
- 100 Dellwood Dr NW
- 103 Wooten Dr SW
- 112 Presley St SW
- 0 Hermitage Rd Unit 7622917
- 0 Hermitage Rd Unit 10572967
- 0 Cedartown Rd Unit 10479932
- 0 Lexington Ln Unit 7312028
- 0 Lexington Ln Unit 10133164
- 43 Westwood Cir SW
- 2 Castlewood Dr SW
- 23 Sweetspire Dr NW
- 21 Sweetspire Dr NW
- 15 John Ross Dr SW
- 110 Williamson St SW
- 115 Echota Cir SW
- 5 Texas Ave NW
- 11 Texas Ave NW
- 3 Texas Ave NW
- 8 Johnson St NW
- 13 Texas Ave NW
- 13 Texas Ave NW Unit 127
- 4 Johnson St NW
- 12 Johnson St NW
- 10 Texas Ave NW
- 6 Texas Ave NW
- 205 Watson St NW
- 4 Texas Ave NW
- 14 Texas Ave NW
- 203 Watson St NW
- 0 Johnson St
- 15 & 17 Johnson St
- 17 Texas Ave NW
- 201 Watson St NW
- 16 Texas Ave NW
- 215 Watson St NW