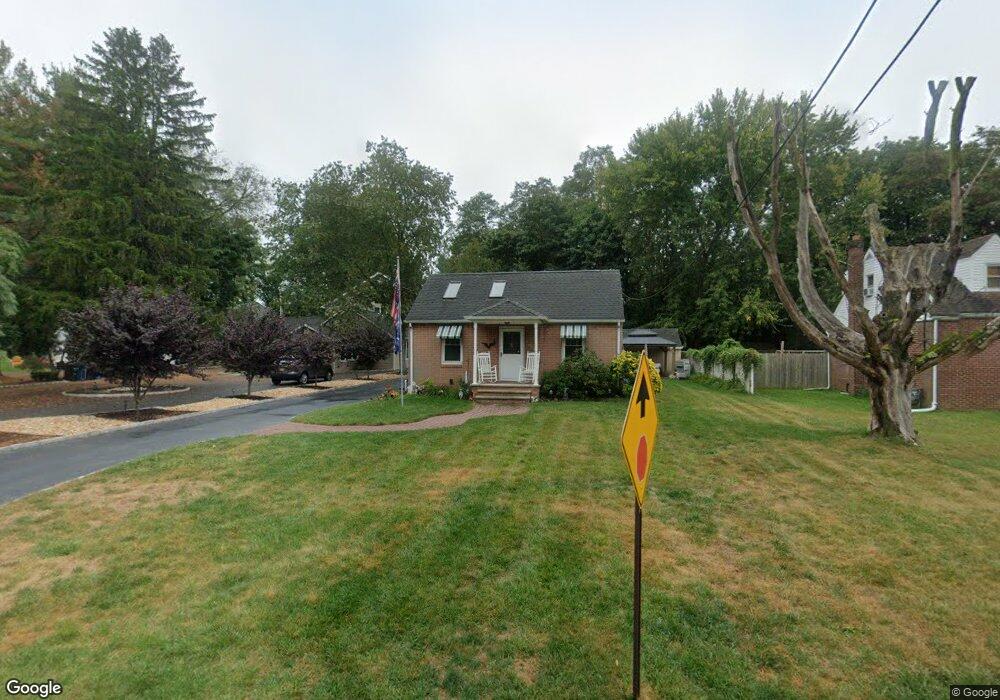
7 Texas Rd Matawan, NJ 07747
Estimated Value: $266,000 - $385,000
1
Bed
1
Bath
632
Sq Ft
$529/Sq Ft
Est. Value
About This Home
This home is located at 7 Texas Rd, Matawan, NJ 07747 and is currently estimated at $334,489, approximately $529 per square foot. 7 Texas Rd is a home located in Monmouth County with nearby schools including Matawan Reg High School, Matawan Montessori Academy, and Shalom Torah Academy.
Ownership History
Date
Name
Owned For
Owner Type
Purchase Details
Closed on
Nov 21, 2001
Sold by
Shelter Solutions Inc
Bought by
Alfonso George
Current Estimated Value
Home Financials for this Owner
Home Financials are based on the most recent Mortgage that was taken out on this home.
Original Mortgage
$108,300
Interest Rate
7.08%
Mortgage Type
FHA
Purchase Details
Closed on
Jun 23, 2000
Sold by
Nogueras Jose
Bought by
Shelter Solutions Inc
Home Financials for this Owner
Home Financials are based on the most recent Mortgage that was taken out on this home.
Original Mortgage
$99,948
Interest Rate
8.59%
Mortgage Type
FHA
Create a Home Valuation Report for This Property
The Home Valuation Report is an in-depth analysis detailing your home's value as well as a comparison with similar homes in the area
Home Values in the Area
Average Home Value in this Area
Purchase History
| Date | Buyer | Sale Price | Title Company |
|---|---|---|---|
| Alfonso George | $110,000 | -- | |
| Shelter Solutions Inc | $100,000 | -- |
Source: Public Records
Mortgage History
| Date | Status | Borrower | Loan Amount |
|---|---|---|---|
| Previous Owner | Alfonso George | $108,300 | |
| Previous Owner | Shelter Solutions Inc | $99,948 |
Source: Public Records
Tax History
| Year | Tax Paid | Tax Assessment Tax Assessment Total Assessment is a certain percentage of the fair market value that is determined by local assessors to be the total taxable value of land and additions on the property. | Land | Improvement |
|---|---|---|---|---|
| 2025 | $6,586 | $270,000 | $161,100 | $108,900 |
| 2024 | $6,529 | $301,700 | $215,100 | $86,600 |
| 2023 | $6,529 | $300,300 | $214,600 | $85,700 |
| 2022 | $6,512 | $273,700 | $192,100 | $81,600 |
| 2021 | $4,607 | $257,500 | $183,100 | $74,400 |
| 2020 | $6,372 | $232,900 | $156,100 | $76,800 |
| 2019 | $5,938 | $217,500 | $142,600 | $74,900 |
| 2018 | $5,758 | $207,500 | $133,600 | $73,900 |
| 2017 | $5,227 | $185,700 | $115,600 | $70,100 |
| 2016 | $4,969 | $180,300 | $111,100 | $69,200 |
| 2015 | $4,855 | $177,500 | $111,100 | $66,400 |
| 2014 | $5,145 | $188,800 | $120,100 | $68,700 |
Source: Public Records
Map
Nearby Homes
Your Personal Tour Guide
Ask me questions while you tour the home.