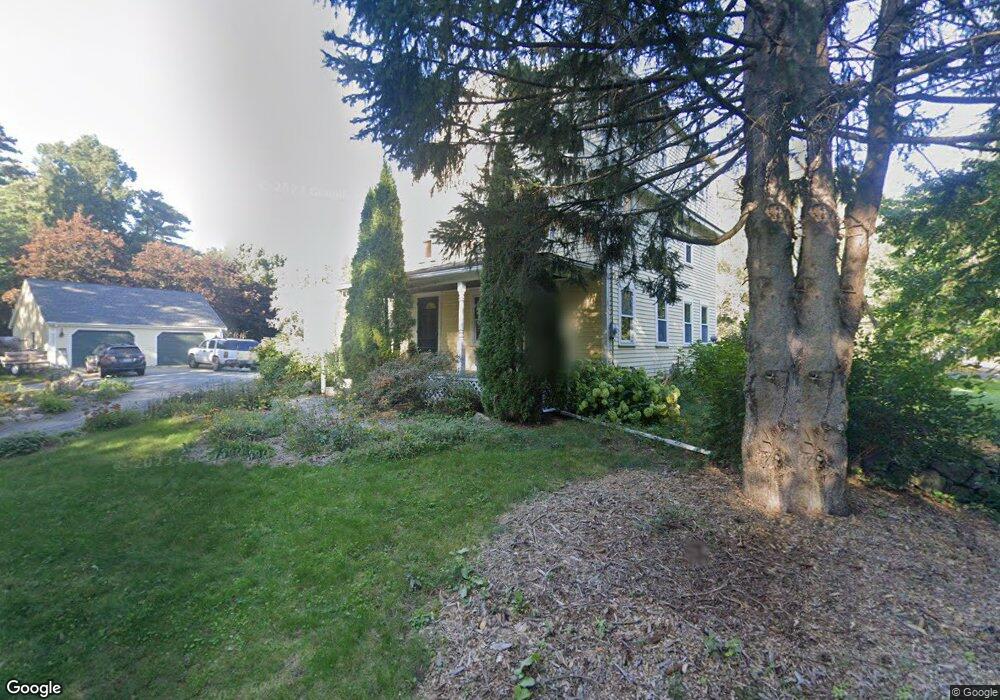
7 Thurlow St Georgetown, MA 01833
Estimated Value: $795,951 - $885,000
5
Beds
2
Baths
2,655
Sq Ft
$322/Sq Ft
Est. Value
About This Home
This home is located at 7 Thurlow St, Georgetown, MA 01833 and is currently estimated at $853,738, approximately $321 per square foot. 7 Thurlow St is a home located in Essex County with nearby schools including Perley Elementary School, Penn Brook School, and Georgetown High School.
Ownership History
Date
Name
Owned For
Owner Type
Purchase Details
Closed on
Jun 4, 2004
Sold by
Nicholl J Christopher and Nicholl Susan F
Bought by
Repplier Laura H and Hehir James J
Current Estimated Value
Purchase Details
Closed on
Dec 21, 1998
Sold by
Odonnell David J and Odonnell Kate A
Bought by
Nicholl J Christopher and Nicholl Susan F
Purchase Details
Closed on
Jul 28, 1995
Sold by
Thurlow Nt and Perry Charles
Bought by
Odonnell David J and Odonnell Kate A
Create a Home Valuation Report for This Property
The Home Valuation Report is an in-depth analysis detailing your home's value as well as a comparison with similar homes in the area
Home Values in the Area
Average Home Value in this Area
Purchase History
| Date | Buyer | Sale Price | Title Company |
|---|---|---|---|
| Repplier Laura H | $450,000 | -- | |
| Nicholl J Christopher | $279,900 | -- | |
| Odonnell David J | $175,000 | -- |
Source: Public Records
Mortgage History
| Date | Status | Borrower | Loan Amount |
|---|---|---|---|
| Open | Odonnell David J | $180,000 | |
| Closed | Odonnell David J | $226,000 |
Source: Public Records
Tax History
| Year | Tax Paid | Tax Assessment Tax Assessment Total Assessment is a certain percentage of the fair market value that is determined by local assessors to be the total taxable value of land and additions on the property. | Land | Improvement |
|---|---|---|---|---|
| 2025 | $7,773 | $702,800 | $307,800 | $395,000 |
| 2024 | $6,989 | $556,900 | $212,300 | $344,600 |
| 2023 | $7,099 | $546,900 | $212,300 | $334,600 |
| 2022 | $7,310 | $519,200 | $184,600 | $334,600 |
| 2021 | $6,632 | $417,400 | $184,600 | $232,800 |
| 2020 | $6,645 | $417,400 | $184,600 | $232,800 |
| 2019 | $6,366 | $403,400 | $181,000 | $222,400 |
| 2018 | $6,406 | $403,400 | $181,000 | $222,400 |
| 2017 | $6,403 | $395,000 | $181,000 | $214,000 |
| 2016 | $5,873 | $370,100 | $181,000 | $189,100 |
| 2015 | $5,570 | $347,500 | $181,000 | $166,500 |
| 2014 | $4,882 | $347,500 | $181,000 | $166,500 |
Source: Public Records
Map
Nearby Homes
Your Personal Tour Guide
Ask me questions while you tour the home.