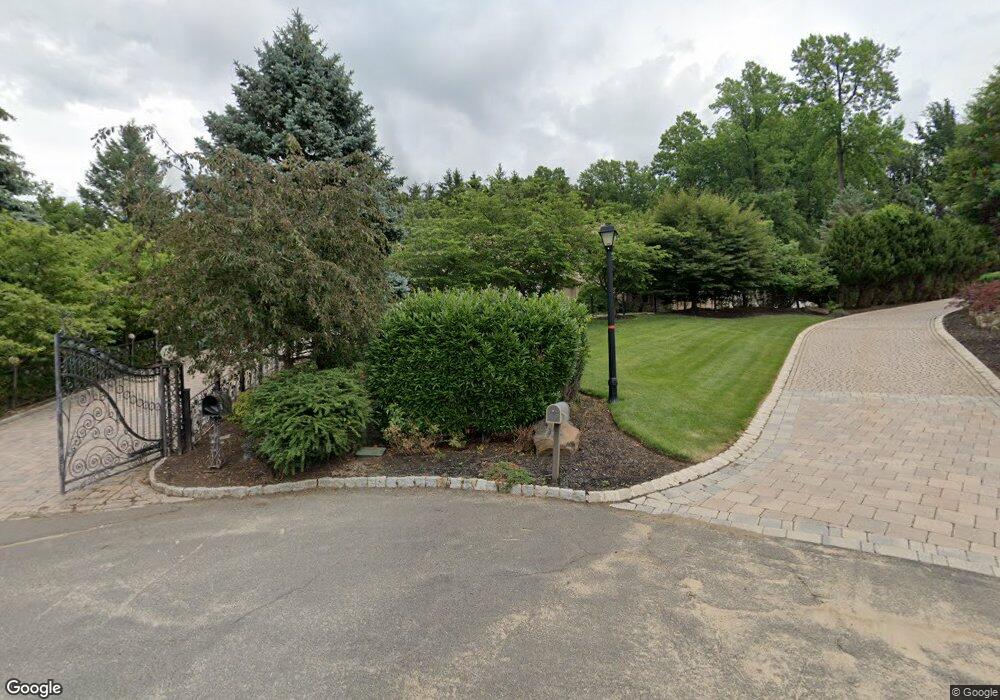
7 Tiffany Way Warren, NJ 07059
Estimated Value: $2,515,951 - $3,474,000
Studio
--
Bath
8,882
Sq Ft
$332/Sq Ft
Est. Value
About This Home
This home is located at 7 Tiffany Way, Warren, NJ 07059 and is currently estimated at $2,951,650, approximately $332 per square foot. 7 Tiffany Way is a home located in Somerset County with nearby schools including Central School, Warren Middle School, and Watchung Hills Regional High School.
Ownership History
Date
Name
Owned For
Owner Type
Purchase Details
Closed on
Nov 19, 1998
Sold by
Glover Ronald
Bought by
Shah Shailesh and Shah Bharti
Current Estimated Value
Purchase Details
Closed on
May 11, 1992
Sold by
Messano Charles and Messano Beth
Bought by
Glover Ronald K and Glover Rosemarie M
Create a Home Valuation Report for This Property
The Home Valuation Report is an in-depth analysis detailing your home's value as well as a comparison with similar homes in the area
Home Values in the Area
Average Home Value in this Area
Purchase History
| Date | Buyer | Sale Price | Title Company |
|---|---|---|---|
| Shah Shailesh | $1,700,000 | -- | |
| Glover Ronald K | $1,550,000 | -- |
Source: Public Records
Tax History
| Year | Tax Paid | Tax Assessment Tax Assessment Total Assessment is a certain percentage of the fair market value that is determined by local assessors to be the total taxable value of land and additions on the property. | Land | Improvement |
|---|---|---|---|---|
| 2025 | $46,623 | $2,730,300 | $475,300 | $2,255,000 |
| 2024 | $46,623 | $2,536,600 | $431,100 | $2,105,500 |
| 2023 | $45,979 | $2,372,500 | $402,800 | $1,969,700 |
| 2022 | $45,141 | $2,271,800 | $383,600 | $1,888,200 |
| 2021 | $45,726 | $2,202,600 | $368,800 | $1,833,800 |
| 2020 | $45,033 | $2,175,500 | $368,800 | $1,806,700 |
| 2019 | $44,685 | $2,192,600 | $361,600 | $1,831,000 |
| 2018 | $43,549 | $2,191,700 | $354,600 | $1,837,100 |
| 2017 | $44,424 | $2,234,600 | $316,500 | $1,918,100 |
| 2016 | $44,220 | $2,201,100 | $316,500 | $1,884,600 |
| 2015 | $44,474 | $2,171,600 | $307,300 | $1,864,300 |
| 2014 | $43,706 | $2,145,600 | $307,300 | $1,838,300 |
Source: Public Records
Map
Nearby Homes
- 12 Jessica Ln
- 14 Broadway Rd
- 112 King George Rd
- 7 Sycamore Way
- 15 Quail Run
- 13 Sycamore Way
- 3 Concord Ct
- 2 Willow Woods Trail
- 8 Cobblestone Ct
- 9 Apple Tree Ln
- 59 Ferguson Rd
- 302 Tiffany Way Unit 302
- 118 Old Stirling Rd
- 17 Old Church Rd
- 122 Old Stirling Rd
- 4 Marigold Ct
- 13 Deer Path Cir
- 47 Brookside Dr
- 1 Juniper Pointe Trail
- 4 Harlow Pointe Cove
Your Personal Tour Guide
Ask me questions while you tour the home.