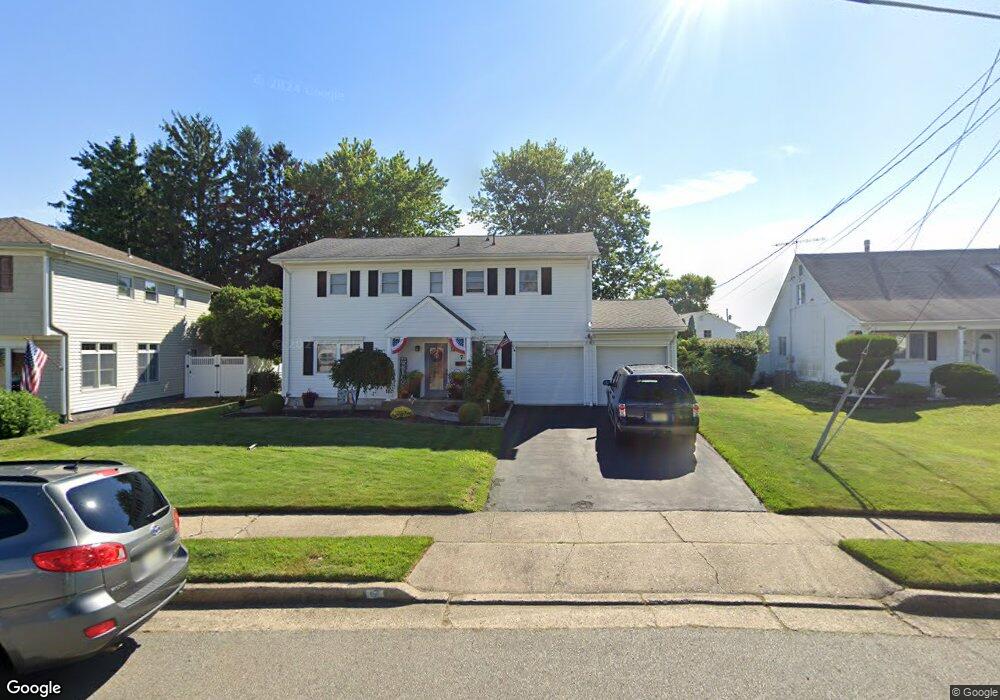
7 Tralee Rd Hazlet, NJ 07730
Estimated Value: $666,000 - $736,000
4
Beds
3
Baths
2,230
Sq Ft
$310/Sq Ft
Est. Value
About This Home
This home is located at 7 Tralee Rd, Hazlet, NJ 07730 and is currently estimated at $690,846, approximately $309 per square foot. 7 Tralee Rd is a home located in Monmouth County with nearby schools including Raritan High School, St Benedict School, and St. Joseph Elementary School.
Ownership History
Date
Name
Owned For
Owner Type
Purchase Details
Closed on
May 29, 2009
Sold by
Westpy Glen R and Westpy Sherry
Bought by
Clifford John
Current Estimated Value
Home Financials for this Owner
Home Financials are based on the most recent Mortgage that was taken out on this home.
Original Mortgage
$200,000
Outstanding Balance
$126,771
Interest Rate
4.83%
Mortgage Type
Purchase Money Mortgage
Estimated Equity
$564,075
Purchase Details
Closed on
Jan 15, 2004
Sold by
Newton Elliott
Bought by
Westpy Glen and Westpy Sherry
Home Financials for this Owner
Home Financials are based on the most recent Mortgage that was taken out on this home.
Original Mortgage
$210,000
Interest Rate
5.65%
Create a Home Valuation Report for This Property
The Home Valuation Report is an in-depth analysis detailing your home's value as well as a comparison with similar homes in the area
Home Values in the Area
Average Home Value in this Area
Purchase History
| Date | Buyer | Sale Price | Title Company |
|---|---|---|---|
| Clifford John | $355,000 | Stewart Title Guaranty Co | |
| Westpy Glen | $405,000 | -- |
Source: Public Records
Mortgage History
| Date | Status | Borrower | Loan Amount |
|---|---|---|---|
| Open | Clifford John | $200,000 | |
| Previous Owner | Westpy Glen | $210,000 |
Source: Public Records
Tax History Compared to Growth
Tax History
| Year | Tax Paid | Tax Assessment Tax Assessment Total Assessment is a certain percentage of the fair market value that is determined by local assessors to be the total taxable value of land and additions on the property. | Land | Improvement |
|---|---|---|---|---|
| 2025 | $11,062 | $588,900 | $376,900 | $212,000 |
| 2024 | $10,709 | $526,000 | $314,900 | $211,100 |
| 2023 | $10,709 | $501,100 | $291,900 | $209,200 |
| 2022 | $10,232 | $429,300 | $226,900 | $202,400 |
| 2021 | $10,232 | $398,900 | $218,900 | $180,000 |
| 2020 | $10,039 | $388,800 | $212,900 | $175,900 |
| 2019 | $9,752 | $371,800 | $196,900 | $174,900 |
| 2018 | $9,541 | $360,700 | $193,900 | $166,800 |
| 2017 | $9,273 | $350,600 | $188,900 | $161,700 |
| 2016 | $9,130 | $346,500 | $188,900 | $157,600 |
| 2015 | $9,148 | $348,100 | $187,900 | $160,200 |
| 2014 | $8,818 | $314,700 | $161,900 | $152,800 |
Source: Public Records
Map
Nearby Homes