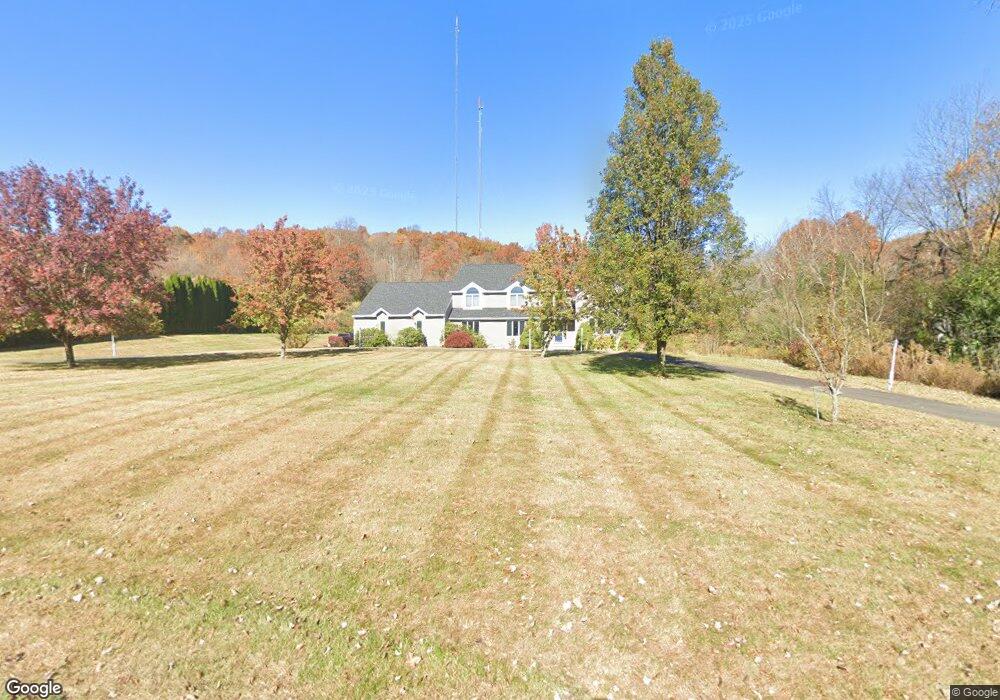
7 Trumbull Ln Unit LA Farmington, CT 06032
Estimated Value: $887,109 - $925,000
4
Beds
4
Baths
3,890
Sq Ft
$232/Sq Ft
Est. Value
About This Home
This home is located at 7 Trumbull Ln Unit LA, Farmington, CT 06032 and is currently estimated at $903,777, approximately $232 per square foot. 7 Trumbull Ln Unit LA is a home located in Hartford County with nearby schools including Noah Wallace School, West Woods Upper Elementary School, and Irving A. Robbins Middle School.
Ownership History
Date
Name
Owned For
Owner Type
Purchase Details
Closed on
Jul 18, 2025
Sold by
Gan Daniel and Fiel Mary
Bought by
Diaz Kaitlin and Diaz Armando
Current Estimated Value
Home Financials for this Owner
Home Financials are based on the most recent Mortgage that was taken out on this home.
Original Mortgage
$550,000
Outstanding Balance
$548,599
Interest Rate
6.85%
Mortgage Type
New Conventional
Estimated Equity
$355,178
Purchase Details
Closed on
Nov 2, 2009
Sold by
Curtis Regina M
Bought by
Fiel-Gan Mary and Gan Daniel
Home Financials for this Owner
Home Financials are based on the most recent Mortgage that was taken out on this home.
Original Mortgage
$417,000
Interest Rate
5.06%
Mortgage Type
Purchase Money Mortgage
Purchase Details
Closed on
Dec 8, 1995
Sold by
Hinkson Robert and Hinkson Jeannette
Bought by
Curtis Jeffrey and Curtis Rejean
Create a Home Valuation Report for This Property
The Home Valuation Report is an in-depth analysis detailing your home's value as well as a comparison with similar homes in the area
Home Values in the Area
Average Home Value in this Area
Purchase History
| Date | Buyer | Sale Price | Title Company |
|---|---|---|---|
| Diaz Kaitlin | $900,000 | -- | |
| Fiel-Gan Mary | $617,000 | -- | |
| Fiel-Gan Mary | $617,000 | -- | |
| Curtis Jeffrey | $125,000 | -- |
Source: Public Records
Mortgage History
| Date | Status | Borrower | Loan Amount |
|---|---|---|---|
| Open | Diaz Kaitlin | $550,000 | |
| Previous Owner | Curtis Jeffrey | $417,000 | |
| Previous Owner | Curtis Jeffrey | $76,000 |
Source: Public Records
Tax History Compared to Growth
Tax History
| Year | Tax Paid | Tax Assessment Tax Assessment Total Assessment is a certain percentage of the fair market value that is determined by local assessors to be the total taxable value of land and additions on the property. | Land | Improvement |
|---|---|---|---|---|
| 2025 | $14,656 | $550,550 | $128,380 | $422,170 |
| 2024 | $14,011 | $550,550 | $128,380 | $422,170 |
| 2023 | $13,329 | $550,550 | $128,380 | $422,170 |
| 2022 | $12,781 | $435,910 | $112,070 | $323,840 |
| 2021 | $12,559 | $435,910 | $112,070 | $323,840 |
| 2020 | $12,192 | $435,910 | $112,070 | $323,840 |
| 2019 | $12,192 | $435,910 | $112,070 | $323,840 |
| 2018 | $11,848 | $435,910 | $112,070 | $323,840 |
| 2017 | $12,346 | $462,750 | $137,200 | $325,550 |
| 2016 | $11,930 | $462,750 | $137,200 | $325,550 |
| 2015 | $11,573 | $462,750 | $137,200 | $325,550 |
| 2014 | $11,311 | $462,820 | $137,270 | $325,550 |
Source: Public Records
Map
Nearby Homes
- 67 Forest Hills Dr
- 106 Pinnacle Rd
- 276 Cooke St
- 48 Plum Tree Rd
- 53 Birch Tree Rd
- 0 Main Gate
- 8128 Colt Hwy
- 242 Farmington Ave
- 50 Poplar Hill Dr
- 157 Skinner Dr
- 1114 Fienemann Rd
- 98 Rockwell Ave
- 9 Pearl St
- 230 Hillhurst Ave
- 251 Pershing Ave
- 97 Trumbull Ave
- 101 Maplehurst Ave
- 151 Sterling St
- 87 Pinehurst Ave
- 42 Cleveland St