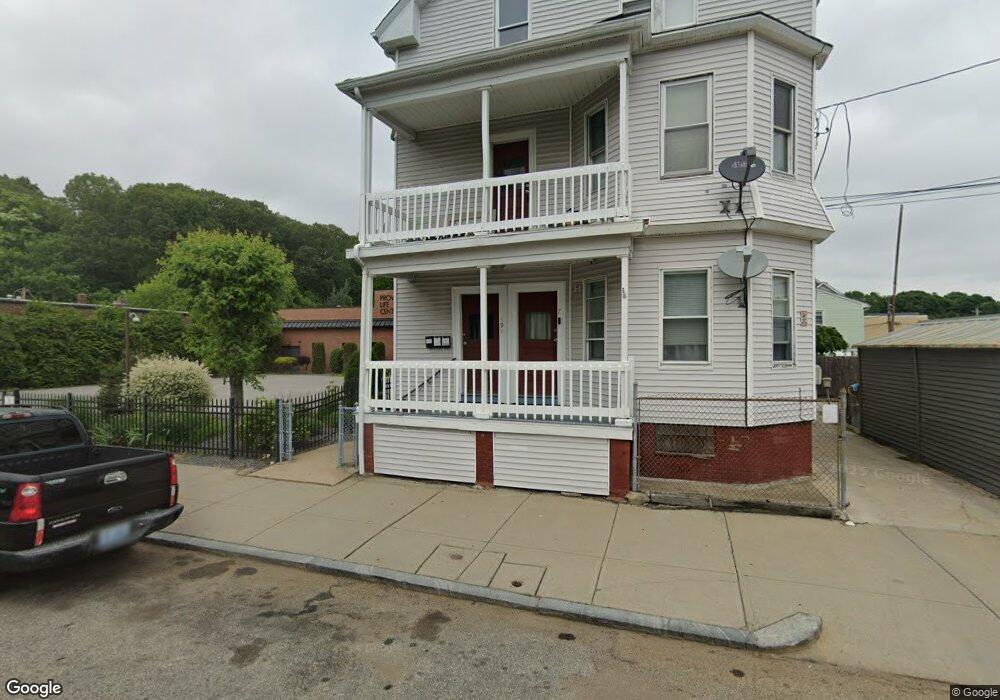
7 Turner St Providence, RI 02908
Valley NeighborhoodEstimated Value: $574,000 - $624,000
11
Beds
4
Baths
3,051
Sq Ft
$195/Sq Ft
Est. Value
About This Home
This home is located at 7 Turner St, Providence, RI 02908 and is currently estimated at $595,333, approximately $195 per square foot. 7 Turner St is a home located in Providence County with nearby schools including Asa Messer Elementary School, Charles N. Fortes Elementary School, and Laurel Hill Annex School.
Ownership History
Date
Name
Owned For
Owner Type
Purchase Details
Closed on
Mar 10, 2011
Sold by
Hww Llc
Bought by
Hww Llc
Current Estimated Value
Purchase Details
Closed on
May 15, 2009
Sold by
Wells Fargo Bank Na
Bought by
Sahagian John R
Purchase Details
Closed on
Apr 3, 2009
Sold by
Torres Inmar and Wells Fargo Bank Na Tr
Bought by
Wells Fargo Bank Na Tr
Purchase Details
Closed on
Feb 20, 2003
Sold by
Peterson Clyde E and Peterson Annette I
Bought by
Torres Inmar
Create a Home Valuation Report for This Property
The Home Valuation Report is an in-depth analysis detailing your home's value as well as a comparison with similar homes in the area
Home Values in the Area
Average Home Value in this Area
Purchase History
| Date | Buyer | Sale Price | Title Company |
|---|---|---|---|
| Hww Llc | -- | -- | |
| Sahagian John R | $110,500 | -- | |
| Wells Fargo Bank Na Tr | $84,139 | -- | |
| Torres Inmar | $156,000 | -- |
Source: Public Records
Mortgage History
| Date | Status | Borrower | Loan Amount |
|---|---|---|---|
| Previous Owner | Torres Inmar | $280,000 | |
| Previous Owner | Torres Inmar | $15,000 |
Source: Public Records
Tax History Compared to Growth
Tax History
| Year | Tax Paid | Tax Assessment Tax Assessment Total Assessment is a certain percentage of the fair market value that is determined by local assessors to be the total taxable value of land and additions on the property. | Land | Improvement |
|---|---|---|---|---|
| 2025 | $3,536 | $468,400 | $110,800 | $357,600 |
| 2024 | $5,624 | $306,500 | $67,300 | $239,200 |
| 2023 | $5,624 | $306,500 | $67,300 | $239,200 |
| 2022 | $5,456 | $306,500 | $67,300 | $239,200 |
| 2021 | $4,534 | $184,600 | $45,200 | $139,400 |
| 2020 | $4,534 | $184,600 | $45,200 | $139,400 |
| 2019 | $4,534 | $184,600 | $45,200 | $139,400 |
| 2018 | $3,570 | $111,700 | $35,600 | $76,100 |
| 2017 | $3,570 | $111,700 | $35,600 | $76,100 |
| 2016 | $3,570 | $111,700 | $35,600 | $76,100 |
| 2015 | $3,413 | $103,100 | $43,900 | $59,200 |
| 2014 | $3,480 | $103,100 | $43,900 | $59,200 |
| 2013 | $3,480 | $103,100 | $43,900 | $59,200 |
Source: Public Records
Map
Nearby Homes