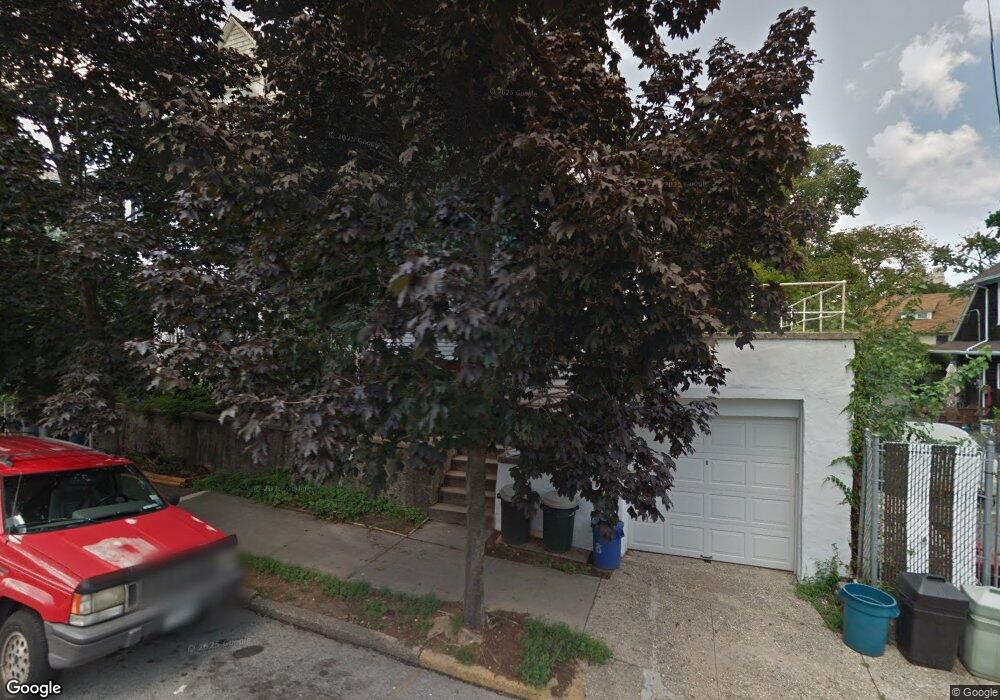
7 Vine St Staten Island, NY 10301
Saint George NeighborhoodEstimated Value: $686,000 - $1,065,553
6
Beds
4
Baths
3,696
Sq Ft
$250/Sq Ft
Est. Value
About This Home
This home is located at 7 Vine St, Staten Island, NY 10301 and is currently estimated at $924,388, approximately $250 per square foot. 7 Vine St is a home located in Richmond County with nearby schools including P.S. 16 John J Driscoll, Fort Hill Collaborative Elementary, and P.S. 74 Future Leaders Elementary School.
Ownership History
Date
Name
Owned For
Owner Type
Purchase Details
Closed on
Apr 19, 2019
Sold by
Graves Joseph P and Monry Jennifer Elizabeth
Bought by
Monty Jennifer Elizabeth
Current Estimated Value
Purchase Details
Closed on
Jul 23, 2013
Sold by
Way S Elizabeth and Scheer Gregor
Bought by
Graves Joseph P and Graves Monty Jennifer
Home Financials for this Owner
Home Financials are based on the most recent Mortgage that was taken out on this home.
Original Mortgage
$287,500
Outstanding Balance
$69,900
Interest Rate
4.45%
Mortgage Type
New Conventional
Estimated Equity
$854,488
Purchase Details
Closed on
Dec 9, 2002
Sold by
Raush Neal and Scarcia Jill
Bought by
Way S Elizabeth and Scheer Gregor
Purchase Details
Closed on
Nov 30, 1998
Sold by
Martin Julia I
Bought by
Raush Neal and Scarcia Jill
Home Financials for this Owner
Home Financials are based on the most recent Mortgage that was taken out on this home.
Original Mortgage
$209,000
Interest Rate
6.7%
Create a Home Valuation Report for This Property
The Home Valuation Report is an in-depth analysis detailing your home's value as well as a comparison with similar homes in the area
Home Values in the Area
Average Home Value in this Area
Purchase History
| Date | Buyer | Sale Price | Title Company |
|---|---|---|---|
| Monty Jennifer Elizabeth | -- | Forest Abstract Co | |
| Graves Joseph P | $575,000 | None Available | |
| Way S Elizabeth | $400,000 | Fidelity National Title Ins | |
| Raush Neal | $220,000 | -- |
Source: Public Records
Mortgage History
| Date | Status | Borrower | Loan Amount |
|---|---|---|---|
| Open | Graves Joseph P | $287,500 | |
| Previous Owner | Raush Neal | $209,000 |
Source: Public Records
Tax History Compared to Growth
Tax History
| Year | Tax Paid | Tax Assessment Tax Assessment Total Assessment is a certain percentage of the fair market value that is determined by local assessors to be the total taxable value of land and additions on the property. | Land | Improvement |
|---|---|---|---|---|
| 2025 | $5,797 | $49,920 | $6,472 | $43,448 |
| 2024 | $5,797 | $53,280 | $5,720 | $47,560 |
| 2023 | $5,579 | $27,469 | $4,644 | $22,825 |
| 2022 | $5,484 | $53,760 | $10,560 | $43,200 |
| 2021 | $5,687 | $48,840 | $10,560 | $38,280 |
| 2020 | $5,397 | $51,240 | $10,560 | $40,680 |
| 2019 | $5,031 | $44,520 | $10,560 | $33,960 |
| 2018 | $4,369 | $22,891 | $7,433 | $15,458 |
| 2017 | $4,367 | $22,891 | $8,953 | $13,938 |
| 2016 | $4,192 | $22,519 | $7,958 | $14,561 |
| 2015 | $3,542 | $21,246 | $6,426 | $14,820 |
| 2014 | $3,542 | $20,044 | $5,612 | $14,432 |
Source: Public Records
Map
Nearby Homes
- 31 Crescent Ave
- 36 Hamilton Ave Unit 4S
- 36 Hamilton Ave Unit 2E
- 36 Hamilton Ave Unit 6H
- 36 Hamilton Ave Unit 5A
- 36 Hamilton Ave Unit 6S
- 36 Hamilton Ave Unit 6T
- 36 Hamilton Ave Unit 3A
- 36 Hamilton Ave Unit 6J
- 36 Hamilton Ave Unit 4B
- 50 Fort Place Unit B3C
- 50 Fort Place Unit A6B
- 50 Fort Place Unit B3AB
- 50 Fort Place Unit A3J
- 50 Fort Place Unit B4C
- 301 Westervelt Ave
- 106 Carroll Place
- 165 Daniel Low Terrace
- 0 Carroll Place
- 0 Bay St Unit 2503634
- 5 Vine St
- 3 Vine St
- 36 Belmont Place
- 1 Vine St
- 2 Belmont Place
- 48 Belmont Place
- 50 Belmont Place
- 55 Daniel Low Terrace
- 8 Vine St
- 6 Vine St
- 54 Belmont Place
- 19 Belmont Place
- 11 Belmont Place
- 56 Belmont Place
- 25 Belmont Place
- 59 Daniel Low Terrace
- 60 Belmont Place
- 37 Belmont Place
- 5 Belmont Place
- 62 Belmont Place