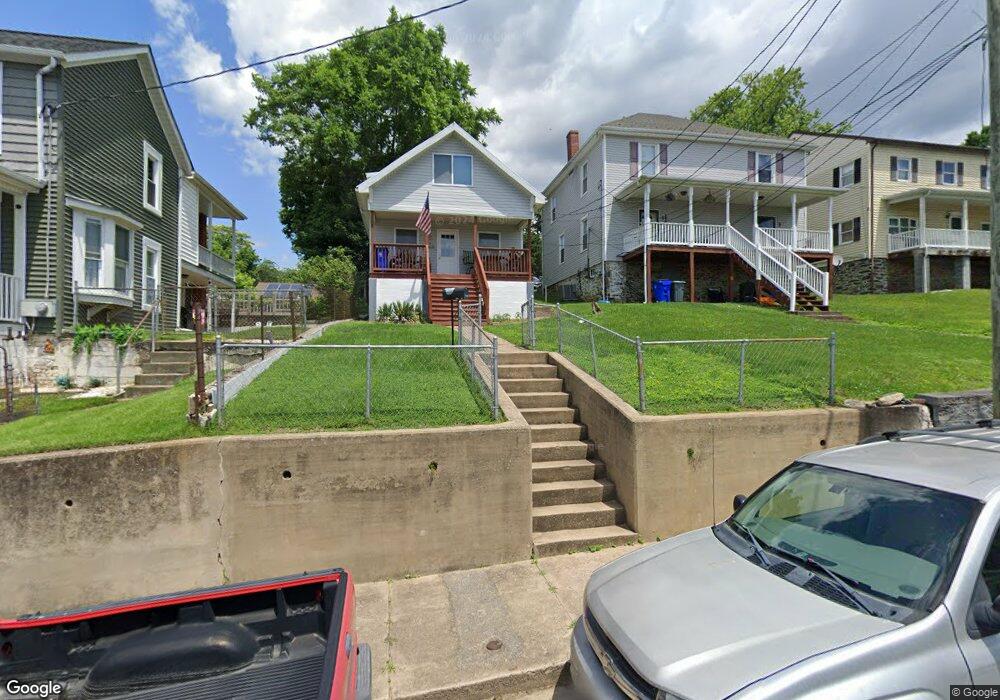
7 W C St Brunswick, MD 21716
Estimated Value: $220,000 - $252,000
2
Beds
1
Bath
840
Sq Ft
$288/Sq Ft
Est. Value
About This Home
This home is located at 7 W C St, Brunswick, MD 21716 and is currently estimated at $241,537, approximately $287 per square foot. 7 W C St is a home located in Frederick County with nearby schools including Brunswick Elementary School, Brunswick Middle School, and Brunswick High School.
Ownership History
Date
Name
Owned For
Owner Type
Purchase Details
Closed on
Mar 17, 2010
Sold by
Beneficial Mortgage Co Of Md
Bought by
Felgate Clive and Felgate Elizabeth
Current Estimated Value
Purchase Details
Closed on
Jan 19, 2010
Sold by
Dinterman Randy
Bought by
Beneficial Mortgage Co Of Md
Purchase Details
Closed on
Mar 27, 2001
Sold by
Oden Jeffrey A
Bought by
Dinterman Randy
Purchase Details
Closed on
Jun 18, 1998
Sold by
Nichols James
Bought by
Oden Jeffrey A and Mcandrew Shannon
Create a Home Valuation Report for This Property
The Home Valuation Report is an in-depth analysis detailing your home's value as well as a comparison with similar homes in the area
Home Values in the Area
Average Home Value in this Area
Purchase History
| Date | Buyer | Sale Price | Title Company |
|---|---|---|---|
| Felgate Clive | $42,500 | -- | |
| Beneficial Mortgage Co Of Md | $89,070 | -- | |
| Dinterman Randy | $64,000 | -- | |
| Oden Jeffrey A | $54,900 | -- |
Source: Public Records
Mortgage History
| Date | Status | Borrower | Loan Amount |
|---|---|---|---|
| Previous Owner | Dinterman Randy | $15,661 | |
| Previous Owner | Dinterman Randy | $146,349 | |
| Closed | Oden Jeffrey A | -- |
Source: Public Records
Tax History Compared to Growth
Tax History
| Year | Tax Paid | Tax Assessment Tax Assessment Total Assessment is a certain percentage of the fair market value that is determined by local assessors to be the total taxable value of land and additions on the property. | Land | Improvement |
|---|---|---|---|---|
| 2025 | $2,502 | $162,600 | -- | -- |
| 2024 | $2,502 | $149,700 | $60,000 | $89,700 |
| 2023 | $2,251 | $136,700 | $0 | $0 |
| 2022 | $2,045 | $123,700 | $0 | $0 |
| 2021 | $1,818 | $110,700 | $35,000 | $75,700 |
| 2020 | $1,742 | $104,567 | $0 | $0 |
| 2019 | $1,627 | $98,433 | $0 | $0 |
| 2018 | $1,469 | $92,300 | $25,200 | $67,100 |
| 2017 | $1,537 | $92,300 | $0 | $0 |
| 2016 | $1,693 | $90,967 | $0 | $0 |
| 2015 | $1,693 | $90,300 | $0 | $0 |
| 2014 | $1,693 | $90,300 | $0 | $0 |
Source: Public Records
Map
Nearby Homes