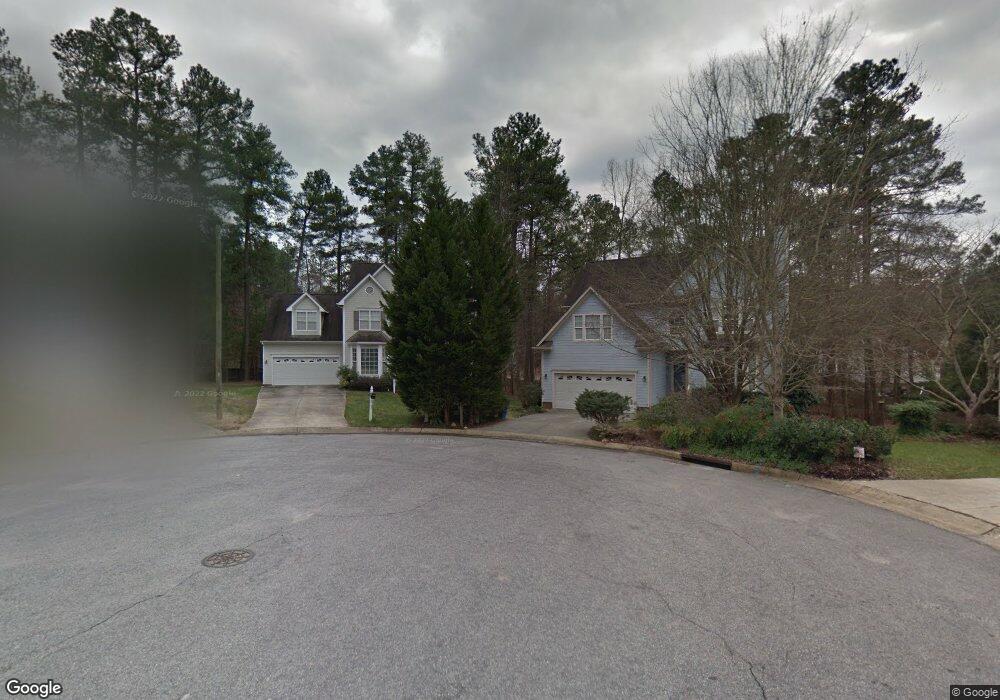
7 Waconda Ct Durham, NC 27713
Woodcroft NeighborhoodEstimated Value: $555,945 - $654,000
3
Beds
3
Baths
2,178
Sq Ft
$271/Sq Ft
Est. Value
About This Home
This home is located at 7 Waconda Ct, Durham, NC 27713 and is currently estimated at $590,486, approximately $271 per square foot. 7 Waconda Ct is a home located in Durham County with nearby schools including Pearsontown Elementary School, Lowe's Grove Middle, and Hillside High School.
Ownership History
Date
Name
Owned For
Owner Type
Purchase Details
Closed on
Mar 9, 1998
Sold by
Homes By Huff & Co Inc
Bought by
Page Emily Ann
Current Estimated Value
Home Financials for this Owner
Home Financials are based on the most recent Mortgage that was taken out on this home.
Original Mortgage
$168,350
Outstanding Balance
$30,770
Interest Rate
7.01%
Estimated Equity
$559,716
Create a Home Valuation Report for This Property
The Home Valuation Report is an in-depth analysis detailing your home's value as well as a comparison with similar homes in the area
Home Values in the Area
Average Home Value in this Area
Purchase History
| Date | Buyer | Sale Price | Title Company |
|---|---|---|---|
| Page Emily Ann | $177,500 | -- |
Source: Public Records
Mortgage History
| Date | Status | Borrower | Loan Amount |
|---|---|---|---|
| Open | Page Emily Ann | $168,350 |
Source: Public Records
Tax History Compared to Growth
Tax History
| Year | Tax Paid | Tax Assessment Tax Assessment Total Assessment is a certain percentage of the fair market value that is determined by local assessors to be the total taxable value of land and additions on the property. | Land | Improvement |
|---|---|---|---|---|
| 2025 | $5,706 | $575,598 | $167,700 | $407,898 |
| 2024 | $4,252 | $304,796 | $48,412 | $256,384 |
| 2023 | $3,993 | $304,796 | $48,412 | $256,384 |
| 2022 | $3,901 | $304,796 | $48,412 | $256,384 |
| 2021 | $3,883 | $304,796 | $48,412 | $256,384 |
| 2020 | $3,791 | $304,796 | $48,412 | $256,384 |
| 2019 | $3,791 | $304,796 | $48,412 | $256,384 |
| 2018 | $2,911 | $214,627 | $48,412 | $166,215 |
| 2017 | $2,890 | $214,627 | $48,412 | $166,215 |
| 2016 | $2,793 | $214,627 | $48,412 | $166,215 |
| 2015 | $3,409 | $246,245 | $50,279 | $195,966 |
| 2014 | $3,409 | $246,245 | $50,279 | $195,966 |
Source: Public Records
Map
Nearby Homes
- 514 Auburn Square Dr
- 1122 Vermillion Dr
- 909 Windcrest Rd
- 63 Lake Village Dr
- 1003 Crimson Dr Unit 2
- 6502 Barbee Rd
- 1 Lake Hill Dr
- 5624 Barbee Rd
- 2 Lake Village Dr
- 1001 Pebble Creek Crossing Unit 12
- 6132 Yellowstone Dr
- 1045 Flagler St
- 13 Byerly Ct
- 1 Chownings St
- 6 Chelan Ct
- 1062 Flagler St
- 6304 Forest Ridge Dr
- 722 Forge Rd
- 17 Great Oak Ct
- 5700 Barbee Rd