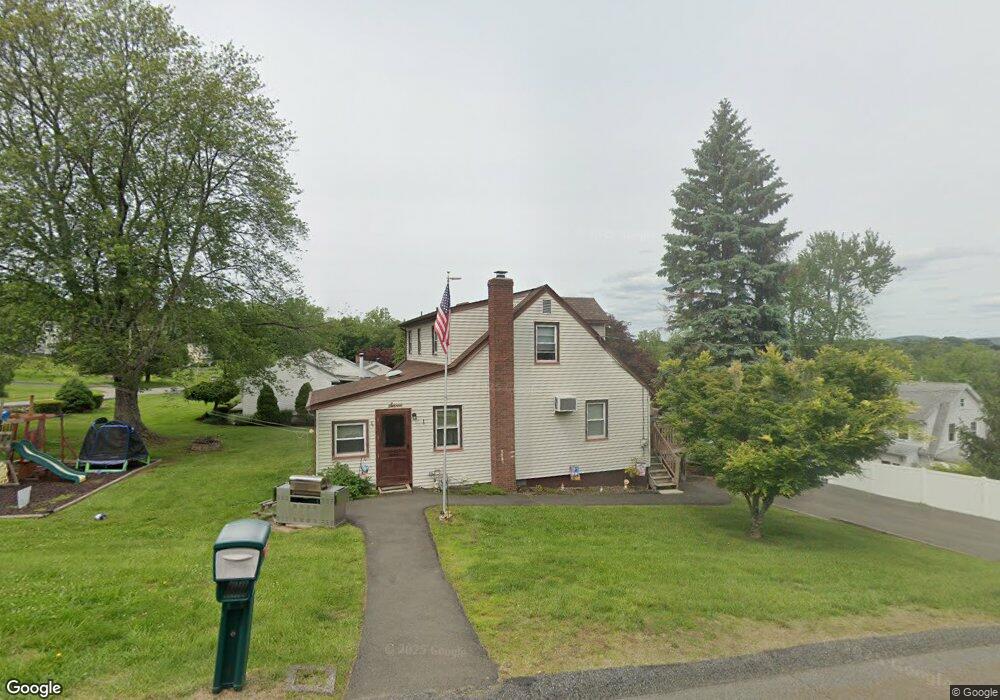
7 Walnut St Stony Point, NY 10980
Estimated Value: $487,124 - $572,000
3
Beds
2
Baths
1,564
Sq Ft
$329/Sq Ft
Est. Value
About This Home
This home is located at 7 Walnut St, Stony Point, NY 10980 and is currently estimated at $515,031, approximately $329 per square foot. 7 Walnut St is a home located in Rockland County with nearby schools including Stony Point Elementary School, James A. Farley Middle School, and Fieldstone Secondary School.
Ownership History
Date
Name
Owned For
Owner Type
Purchase Details
Closed on
Mar 30, 2017
Sold by
Huslinger Kevin
Bought by
Huslinger Christopher
Current Estimated Value
Purchase Details
Closed on
Mar 8, 2017
Sold by
Huslinger Kevin
Bought by
Huslinger Christopher
Purchase Details
Closed on
Jul 31, 2015
Sold by
Huslinger Robert J and Huslinger Eileen C
Bought by
Huslinger Robert J and The Robert J Huslinger Family Revocable
Create a Home Valuation Report for This Property
The Home Valuation Report is an in-depth analysis detailing your home's value as well as a comparison with similar homes in the area
Home Values in the Area
Average Home Value in this Area
Purchase History
| Date | Buyer | Sale Price | Title Company |
|---|---|---|---|
| Huslinger Christopher | $250,000 | None Available | |
| Huslinger Christopher | -- | None Available | |
| Huslinger Robert J | -- | None Available |
Source: Public Records
Tax History
| Year | Tax Paid | Tax Assessment Tax Assessment Total Assessment is a certain percentage of the fair market value that is determined by local assessors to be the total taxable value of land and additions on the property. | Land | Improvement |
|---|---|---|---|---|
| 2022 | $3,151 | $34,300 | $8,800 | $25,500 |
| 2021 | $3,151 | $34,300 | $8,800 | $25,500 |
| 2020 | $9,631 | $34,300 | $8,800 | $25,500 |
| 2019 | $2,739 | $34,300 | $8,800 | $25,500 |
| 2018 | $9,454 | $34,300 | $8,800 | $25,500 |
| 2017 | $9,355 | $34,300 | $8,800 | $25,500 |
| 2016 | $5,183 | $34,300 | $8,800 | $25,500 |
| 2015 | -- | $34,300 | $8,800 | $25,500 |
| 2014 | -- | $34,300 | $8,800 | $25,500 |
Source: Public Records
Map
Nearby Homes
- 20 Prospect St Unit 6, 7, 9, 17
- 4 Prospect St
- 93 N Liberty Dr
- 4 Walnut St
- 97 N Liberty Dr
- 2 Walnut St
- 22 Bayview Dr
- 9 Walnut St
- 87 N Liberty Dr
- 8 Prospect St
- 12 Walnut St
- 18 Bayview Dr
- 103 N Liberty Dr
- 20 Bayview Dr
- 15 Walnut St
- 10 Prospect St
- 20 Walnut St
- 9 Prospect St
- 88 N Liberty Dr
- 16 Bayview Dr
Your Personal Tour Guide
Ask me questions while you tour the home.