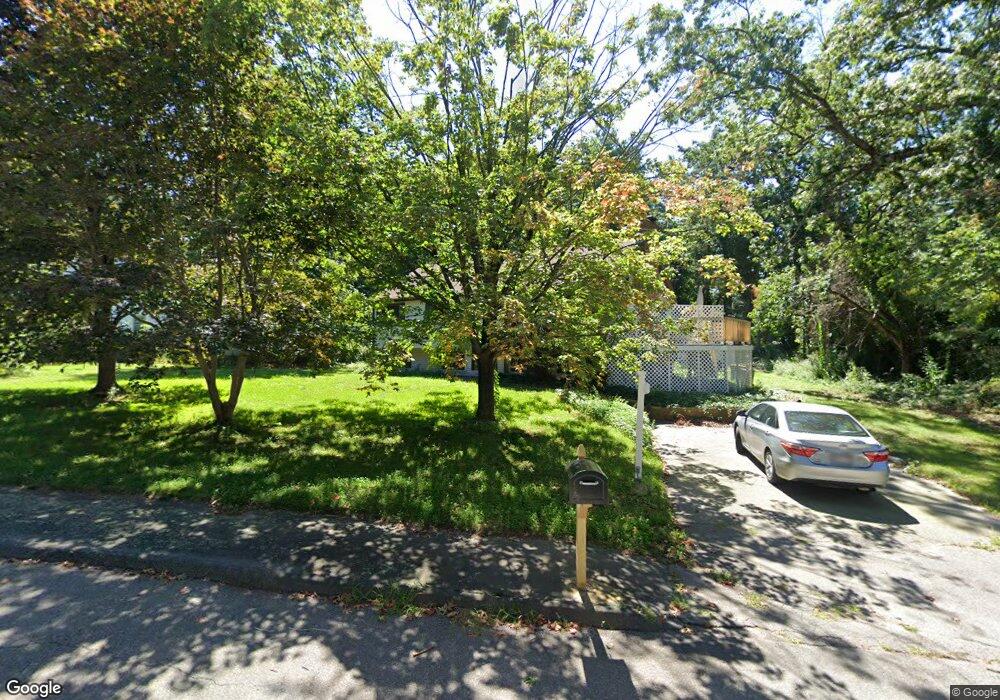
7 Walter Morse Rd Bellingham, MA 02019
Estimated Value: $508,000 - $559,000
3
Beds
2
Baths
1,132
Sq Ft
$472/Sq Ft
Est. Value
About This Home
This home is located at 7 Walter Morse Rd, Bellingham, MA 02019 and is currently estimated at $533,970, approximately $471 per square foot. 7 Walter Morse Rd is a home located in Norfolk County with nearby schools including Stall Brook Elementary School, Bellingham High School, and Bethany Christian Academy.
Ownership History
Date
Name
Owned For
Owner Type
Purchase Details
Closed on
Mar 15, 1999
Sold by
Grella Gene P and Grella Elizabeth A
Bought by
Jackl-Mochel James S
Current Estimated Value
Home Financials for this Owner
Home Financials are based on the most recent Mortgage that was taken out on this home.
Original Mortgage
$172,175
Interest Rate
6.73%
Mortgage Type
Purchase Money Mortgage
Purchase Details
Closed on
Oct 28, 1992
Sold by
Clark Timothy W and Clark Catherine M
Bought by
Grella Gene P and Grella Elizabeth A
Home Financials for this Owner
Home Financials are based on the most recent Mortgage that was taken out on this home.
Original Mortgage
$121,050
Interest Rate
7.85%
Mortgage Type
Purchase Money Mortgage
Purchase Details
Closed on
May 22, 1992
Sold by
Silva Richad J and Silva Joyce T
Bought by
Clark Timothy W and Clark Catherine M
Create a Home Valuation Report for This Property
The Home Valuation Report is an in-depth analysis detailing your home's value as well as a comparison with similar homes in the area
Home Values in the Area
Average Home Value in this Area
Purchase History
| Date | Buyer | Sale Price | Title Company |
|---|---|---|---|
| Jackl-Mochel James S | $177,500 | -- | |
| Grella Gene P | $134,500 | -- | |
| Grella Gene P | $134,500 | -- | |
| Clark Timothy W | $135,000 | -- |
Source: Public Records
Mortgage History
| Date | Status | Borrower | Loan Amount |
|---|---|---|---|
| Open | Clark Timothy W | $239,500 | |
| Closed | Clark Timothy W | $172,175 | |
| Previous Owner | Clark Timothy W | $109,000 | |
| Previous Owner | Clark Timothy W | $121,050 |
Source: Public Records
Tax History Compared to Growth
Tax History
| Year | Tax Paid | Tax Assessment Tax Assessment Total Assessment is a certain percentage of the fair market value that is determined by local assessors to be the total taxable value of land and additions on the property. | Land | Improvement |
|---|---|---|---|---|
| 2025 | $5,381 | $428,400 | $168,100 | $260,300 |
| 2024 | $4,932 | $383,500 | $153,500 | $230,000 |
| 2023 | $4,702 | $360,300 | $146,200 | $214,100 |
| 2022 | $4,561 | $323,900 | $121,900 | $202,000 |
| 2021 | $4,445 | $308,500 | $121,900 | $186,600 |
| 2020 | $4,280 | $301,000 | $121,900 | $179,100 |
| 2019 | $4,189 | $294,800 | $121,900 | $172,900 |
| 2018 | $3,881 | $269,300 | $117,200 | $152,100 |
| 2017 | $3,773 | $263,100 | $117,200 | $145,900 |
| 2016 | $3,613 | $252,800 | $115,300 | $137,500 |
| 2015 | $3,464 | $243,100 | $110,800 | $132,300 |
| 2014 | $3,474 | $237,000 | $108,300 | $128,700 |
Source: Public Records
Map
Nearby Homes
- 22 Roger Belanger Dr
- 49 Monique Dr
- 29 Rawson Rd
- 6 Lisa Ann Dr
- 0 Hartford Ave
- 49 Horseshoe Dr
- 108 N Main St
- 48 Black Bear Cir Unit 48
- 43 Black Bear Cir Unit 43
- 3 Black Bear Cir Unit 3
- 7 Black Bear Unit 7
- 9 Black Bear Cir Unit 9
- 370 S Main St
- 11 Black Bear Unit 11
- 10 Black Bear Unit 10
- 270 S Main St
- 267 S Main St
- 256 S Main St
- 33 Brown Bear Ln Unit 33
- 6 Mellen St
- 11 Walter Morse Rd
- 31 Roger Belanger Dr
- 27 Roger Belanger Dr
- 35 Roger Belanger Dr
- 15 Walter Morse Rd
- 8 Walter Morse Rd
- 23 Roger Belanger Dr
- 16 Walter Morse Rd
- 34 Roger Belanger Dr
- 30 Roger Belanger Dr
- 26 Roger Belanger Dr
- 39 Roger Belanger Dr
- 19 Walter Morse Rd
- 12 Walter Morse Rd
- 19 Roger Belanger Dr
- 20 Walter Morse Rd
- 38 Roger Belanger Dr
- 18 Roger Belanger Dr
- 15 Roger Belanger Dr
- 24 Hixon St