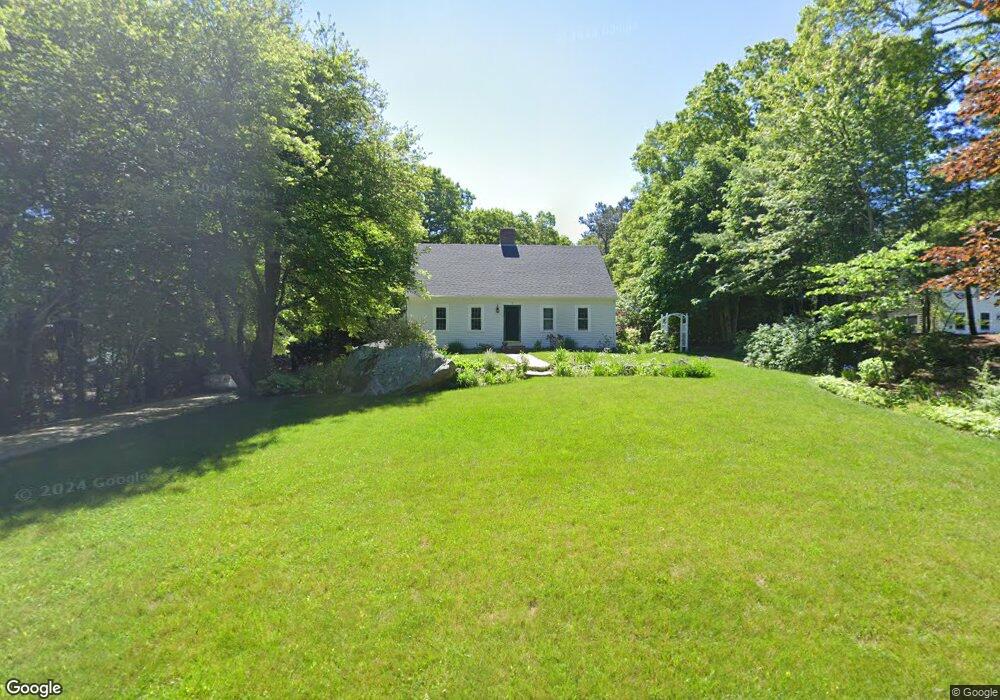
7 Weaver Way Sandwich, MA 02563
Estimated Value: $757,944 - $823,000
3
Beds
2
Baths
2,118
Sq Ft
$369/Sq Ft
Est. Value
About This Home
This home is located at 7 Weaver Way, Sandwich, MA 02563 and is currently estimated at $781,736, approximately $369 per square foot. 7 Weaver Way is a home located in Barnstable County with nearby schools including Sandwich Middle High School, Sandwich Montessori School, and Riverview School.
Ownership History
Date
Name
Owned For
Owner Type
Purchase Details
Closed on
Nov 29, 2021
Sold by
Goddard James S
Bought by
Weaver Way Holdings Llc
Current Estimated Value
Home Financials for this Owner
Home Financials are based on the most recent Mortgage that was taken out on this home.
Original Mortgage
$250,000
Outstanding Balance
$229,749
Interest Rate
3.05%
Mortgage Type
Purchase Money Mortgage
Estimated Equity
$551,987
Purchase Details
Closed on
Jul 26, 1985
Bought by
Balboni Joseph A and Balboni Joann R
Create a Home Valuation Report for This Property
The Home Valuation Report is an in-depth analysis detailing your home's value as well as a comparison with similar homes in the area
Home Values in the Area
Average Home Value in this Area
Purchase History
| Date | Buyer | Sale Price | Title Company |
|---|---|---|---|
| Weaver Way Holdings Llc | -- | None Available | |
| Goddard James S | $600,000 | None Available | |
| Balboni Joseph A | -- | -- |
Source: Public Records
Mortgage History
| Date | Status | Borrower | Loan Amount |
|---|---|---|---|
| Open | Goddard James S | $250,000 | |
| Previous Owner | Balboni Joseph A | $100,000 | |
| Previous Owner | Balboni Joseph A | $100,600 |
Source: Public Records
Tax History Compared to Growth
Tax History
| Year | Tax Paid | Tax Assessment Tax Assessment Total Assessment is a certain percentage of the fair market value that is determined by local assessors to be the total taxable value of land and additions on the property. | Land | Improvement |
|---|---|---|---|---|
| 2025 | $6,424 | $607,800 | $165,200 | $442,600 |
| 2024 | $6,197 | $573,800 | $147,600 | $426,200 |
| 2023 | $6,062 | $527,100 | $134,200 | $392,900 |
| 2022 | $6,033 | $458,400 | $140,500 | $317,900 |
| 2021 | $5,760 | $418,300 | $135,100 | $283,200 |
| 2020 | $5,776 | $403,600 | $135,000 | $268,600 |
| 2019 | $5,818 | $406,300 | $154,600 | $251,700 |
| 2018 | $5,699 | $376,400 | $142,200 | $234,200 |
| 2017 | $5,318 | $356,200 | $137,600 | $218,600 |
| 2016 | $5,072 | $350,500 | $136,200 | $214,300 |
| 2015 | $5,206 | $351,300 | $141,100 | $210,200 |
Source: Public Records
Map
Nearby Homes