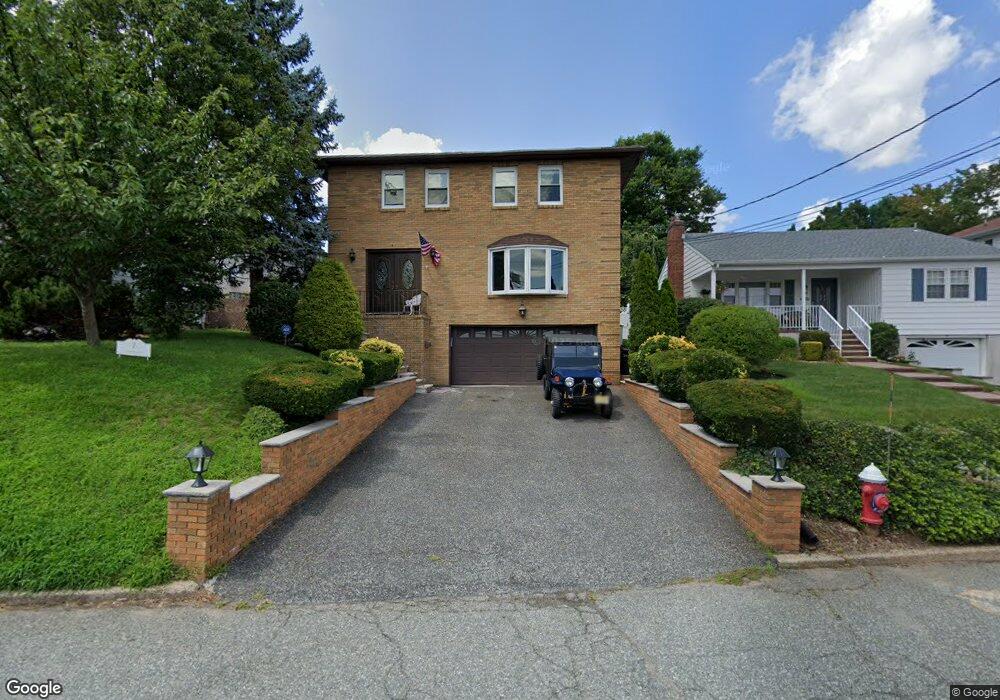
7 Webb Place Hasbrouck Heights, NJ 07604
Estimated Value: $820,930 - $909,000
3
Beds
4
Baths
2,412
Sq Ft
$363/Sq Ft
Est. Value
About This Home
This home is located at 7 Webb Place, Hasbrouck Heights, NJ 07604 and is currently estimated at $874,483, approximately $362 per square foot. 7 Webb Place is a home located in Bergen County with nearby schools including Hasbrouck Heights High School and Corpus Christi School.
Ownership History
Date
Name
Owned For
Owner Type
Purchase Details
Closed on
Nov 19, 2019
Sold by
Powers Sean and Powers Francis
Bought by
Powers Sean and Powers Francis
Current Estimated Value
Home Financials for this Owner
Home Financials are based on the most recent Mortgage that was taken out on this home.
Original Mortgage
$532,880
Outstanding Balance
$469,912
Interest Rate
3.72%
Mortgage Type
FHA
Estimated Equity
$404,571
Purchase Details
Closed on
Oct 10, 2018
Sold by
Mason Thomas E and Mason Constace L
Bought by
Powers Sean and Powers Francis
Home Financials for this Owner
Home Financials are based on the most recent Mortgage that was taken out on this home.
Original Mortgage
$525,309
Interest Rate
4.37%
Mortgage Type
FHA
Purchase Details
Closed on
Nov 17, 2003
Sold by
O'Connor Anne
Bought by
Mason Thomas and Mason Constance
Home Financials for this Owner
Home Financials are based on the most recent Mortgage that was taken out on this home.
Original Mortgage
$195,000
Interest Rate
6.03%
Create a Home Valuation Report for This Property
The Home Valuation Report is an in-depth analysis detailing your home's value as well as a comparison with similar homes in the area
Home Values in the Area
Average Home Value in this Area
Purchase History
| Date | Buyer | Sale Price | Title Company |
|---|---|---|---|
| Powers Sean | -- | Globalserve Title Agcy Corp | |
| Powers Sean | $535,000 | -- | |
| Mason Thomas | $494,375 | -- | |
| -- | $494,400 | -- |
Source: Public Records
Mortgage History
| Date | Status | Borrower | Loan Amount |
|---|---|---|---|
| Open | Powers Sean | $532,880 | |
| Closed | Powers Sean | $525,309 | |
| Previous Owner | -- | $195,000 |
Source: Public Records
Tax History Compared to Growth
Tax History
| Year | Tax Paid | Tax Assessment Tax Assessment Total Assessment is a certain percentage of the fair market value that is determined by local assessors to be the total taxable value of land and additions on the property. | Land | Improvement |
|---|---|---|---|---|
| 2025 | $15,777 | $617,500 | $198,500 | $419,000 |
| 2024 | $16,003 | $617,500 | $198,500 | $419,000 |
| 2023 | $15,689 | $621,000 | $196,000 | $425,000 |
| 2022 | $15,689 | $582,800 | $178,500 | $404,300 |
| 2021 | $15,247 | $539,900 | $169,000 | $370,900 |
| 2020 | $14,889 | $517,700 | $167,000 | $350,700 |
| 2019 | $14,467 | $508,500 | $165,000 | $343,500 |
| 2018 | $14,231 | $499,000 | $163,000 | $336,000 |
| 2017 | $13,989 | $489,800 | $161,000 | $328,800 |
| 2016 | $14,016 | $461,800 | $151,000 | $310,800 |
| 2015 | $13,789 | $461,800 | $151,000 | $310,800 |
| 2014 | $13,411 | $461,800 | $151,000 | $310,800 |
Source: Public Records
Map
Nearby Homes
- 311 Harrison Ave
- 243 Cleveland Ave
- 476 Innes Rd
- 432 Innes Rd
- 420 Innes Rd
- 289 Valley Blvd Unit 1D
- 289 Valley Blvd Unit 1A
- 245 Cliff St
- 560 Ryerson Ave
- 110 Harrison Ave
- 206 Columbia St
- 417 Franklin Ave
- 176 Hackensack St Unit 6
- 165 Madison St
- 167 Columbia St
- 288 Sussex Rd
- 148 Hackensack St
- 573 Anderson Ave
- 38 Springfield Ave
- 444 Washington Place