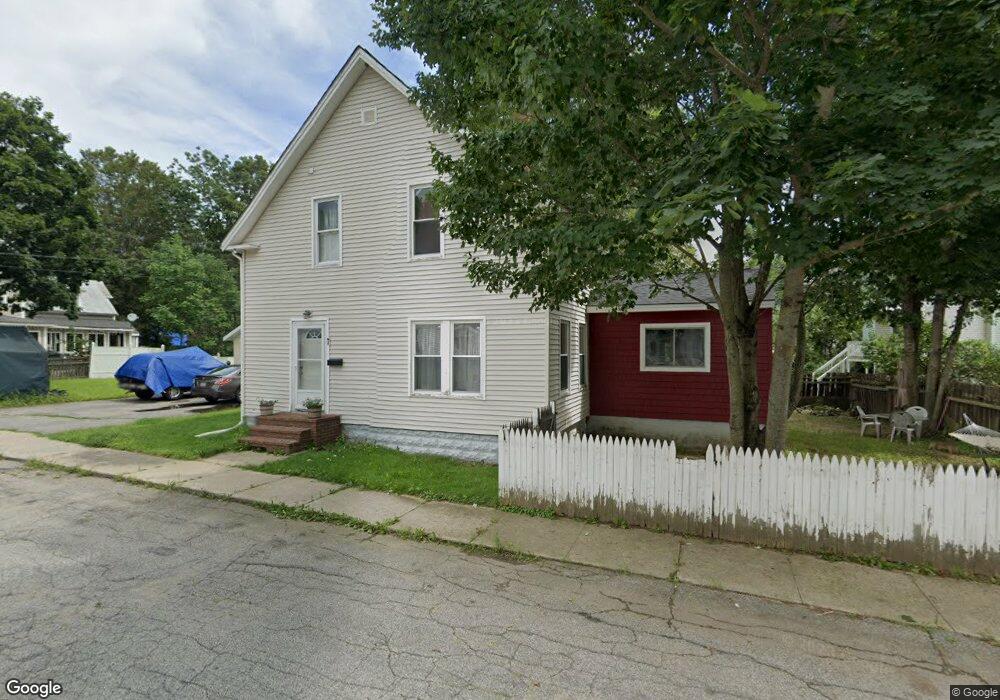
7 Weeman St Springvale, ME 04083
Estimated Value: $308,000 - $333,000
3
Beds
2
Baths
1,237
Sq Ft
$257/Sq Ft
Est. Value
About This Home
This home is located at 7 Weeman St, Springvale, ME 04083 and is currently estimated at $317,549, approximately $256 per square foot. 7 Weeman St is a home located in York County with nearby schools including St Thomas Consolidated School and Sanford Christian Academy.
Ownership History
Date
Name
Owned For
Owner Type
Purchase Details
Closed on
Sep 21, 2007
Sold by
Pension John S and Pension John Stuart
Bought by
Mccannon Laurie-Anne
Current Estimated Value
Home Financials for this Owner
Home Financials are based on the most recent Mortgage that was taken out on this home.
Original Mortgage
$198,000
Outstanding Balance
$124,014
Interest Rate
6.63%
Mortgage Type
Purchase Money Mortgage
Estimated Equity
$193,535
Purchase Details
Closed on
Jun 7, 2005
Sold by
Haskins Karen and Haskins Shawn E
Bought by
Pension John S
Home Financials for this Owner
Home Financials are based on the most recent Mortgage that was taken out on this home.
Original Mortgage
$127,500
Interest Rate
5.83%
Mortgage Type
Purchase Money Mortgage
Create a Home Valuation Report for This Property
The Home Valuation Report is an in-depth analysis detailing your home's value as well as a comparison with similar homes in the area
Home Values in the Area
Average Home Value in this Area
Purchase History
| Date | Buyer | Sale Price | Title Company |
|---|---|---|---|
| Mccannon Laurie-Anne | -- | -- | |
| Pension John S | -- | -- | |
| Pension John S | -- | -- |
Source: Public Records
Mortgage History
| Date | Status | Borrower | Loan Amount |
|---|---|---|---|
| Open | Pension John S | $198,000 | |
| Previous Owner | Pension John S | $127,500 |
Source: Public Records
Tax History
| Year | Tax Paid | Tax Assessment Tax Assessment Total Assessment is a certain percentage of the fair market value that is determined by local assessors to be the total taxable value of land and additions on the property. | Land | Improvement |
|---|---|---|---|---|
| 2025 | $3,659 | $214,000 | $37,000 | $177,000 |
| 2024 | $3,454 | $214,000 | $37,000 | $177,000 |
| 2023 | $3,216 | $212,400 | $37,000 | $175,400 |
| 2022 | $3,144 | $212,400 | $37,000 | $175,400 |
| 2021 | $3,171 | $174,400 | $37,000 | $137,400 |
| 2020 | $3,248 | $161,100 | $37,000 | $124,100 |
| 2019 | $3,020 | $145,900 | $37,000 | $108,900 |
| 2018 | $2,915 | $142,200 | $37,000 | $105,200 |
| 2017 | $2,831 | $136,500 | $37,000 | $99,500 |
| 2016 | $2,833 | $124,600 | $36,900 | $87,700 |
| 2015 | $2,671 | $121,200 | $37,300 | $83,900 |
| 2014 | $2,620 | $121,200 | $37,300 | $83,900 |
| 2013 | -- | $121,200 | $37,300 | $83,900 |
Source: Public Records
Map
Nearby Homes
Your Personal Tour Guide
Ask me questions while you tour the home.