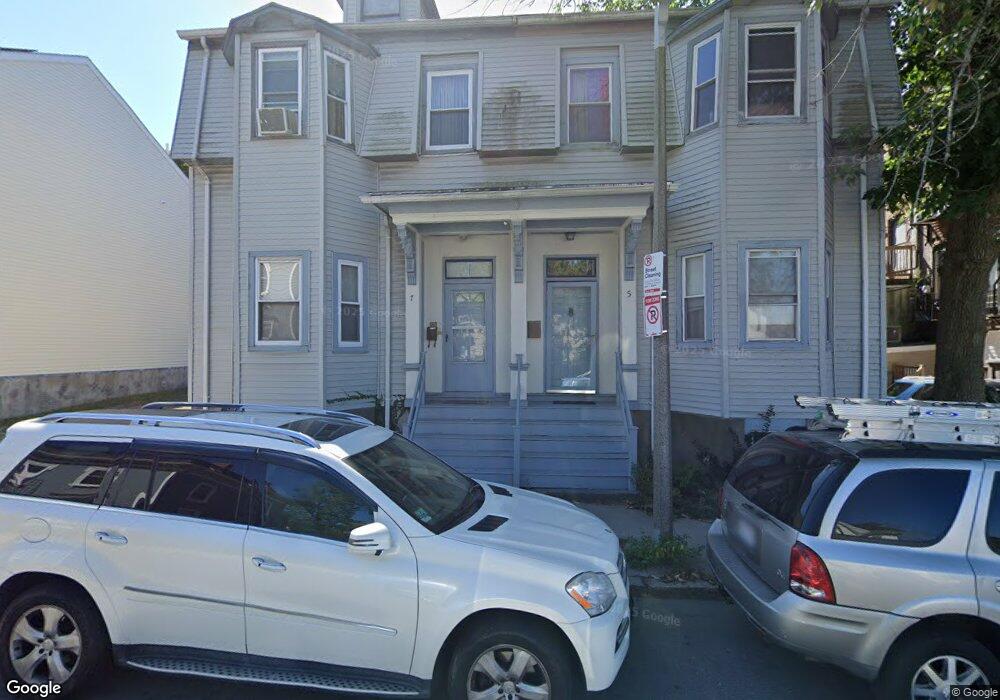
7 Whiting St Roxbury, MA 02119
Sav-Mor NeighborhoodEstimated Value: $519,000 - $657,000
3
Beds
2
Baths
1,494
Sq Ft
$387/Sq Ft
Est. Value
About This Home
This home is located at 7 Whiting St, Roxbury, MA 02119 and is currently estimated at $578,005, approximately $386 per square foot. 7 Whiting St is a home located in Suffolk County with nearby schools including Dudley Street Neighborhood Charter School and City on a Hill Charter Public School.
Ownership History
Date
Name
Owned For
Owner Type
Purchase Details
Closed on
Feb 28, 2017
Sold by
Pearman Vivian
Bought by
Young Crystal A
Current Estimated Value
Home Financials for this Owner
Home Financials are based on the most recent Mortgage that was taken out on this home.
Original Mortgage
$330,814
Outstanding Balance
$275,153
Interest Rate
4.62%
Mortgage Type
FHA
Estimated Equity
$302,852
Purchase Details
Closed on
Jul 21, 1997
Sold by
C-Bass Property I Inc
Bought by
Pearman Vivian
Home Financials for this Owner
Home Financials are based on the most recent Mortgage that was taken out on this home.
Original Mortgage
$52,200
Interest Rate
7.79%
Mortgage Type
Purchase Money Mortgage
Purchase Details
Closed on
Nov 17, 1994
Sold by
Young Jimmy L and Citimae Inc
Bought by
Citimae Inc
Purchase Details
Closed on
Jan 9, 1991
Sold by
Blackstone B & T Co
Bought by
Young Jimmy L and Duncan-Young Linda
Create a Home Valuation Report for This Property
The Home Valuation Report is an in-depth analysis detailing your home's value as well as a comparison with similar homes in the area
Home Values in the Area
Average Home Value in this Area
Purchase History
| Date | Buyer | Sale Price | Title Company |
|---|---|---|---|
| Young Crystal A | $382,500 | -- | |
| Pearman Vivian | $58,000 | -- | |
| Citimae Inc | $49,000 | -- | |
| Young Jimmy L | $108,000 | -- |
Source: Public Records
Mortgage History
| Date | Status | Borrower | Loan Amount |
|---|---|---|---|
| Open | Young Crystal A | $330,814 | |
| Previous Owner | Young Jimmy L | $125,000 | |
| Previous Owner | Young Jimmy L | $52,000 | |
| Previous Owner | Young Jimmy L | $52,200 |
Source: Public Records
Tax History
| Year | Tax Paid | Tax Assessment Tax Assessment Total Assessment is a certain percentage of the fair market value that is determined by local assessors to be the total taxable value of land and additions on the property. | Land | Improvement |
|---|---|---|---|---|
| 2025 | $4,770 | $411,900 | $128,600 | $283,300 |
| 2024 | $4,152 | $380,900 | $131,800 | $249,100 |
| 2023 | $4,091 | $380,900 | $131,800 | $249,100 |
| 2022 | $3,767 | $346,200 | $119,800 | $226,400 |
| 2021 | $3,636 | $340,800 | $119,800 | $221,000 |
| 2020 | $3,154 | $298,700 | $118,100 | $180,600 |
| 2019 | $2,944 | $279,300 | $92,800 | $186,500 |
| 2018 | $2,661 | $253,900 | $92,800 | $161,100 |
| 2017 | $2,609 | $246,400 | $92,800 | $153,600 |
| 2016 | $2,582 | $234,700 | $92,800 | $141,900 |
| 2015 | $2,562 | $211,600 | $64,100 | $147,500 |
| 2014 | $2,585 | $205,500 | $64,100 | $141,400 |
Source: Public Records
Map
Nearby Homes
- 22-22A Montrose St
- 22 Rockville Park
- 20 Rockville Park
- 30 Copeland St Unit 1
- 59 Copeland St
- 33 Copeland St Unit C
- 7 Langford Park Unit 3
- 59 Perrin St Unit 3
- 64 Alpine St Unit 104
- 64 Alpine St Unit 304
- 108 Mount Pleasant Ave Unit 4
- 22 Alaska St
- 102 Mount Pleasant Ave
- 80 Blue Hill Ave Unit 5
- 10 Forest St
- 45 Woodville St
- 12 Forest St
- 51 Saint James St
- 133 Blue Hill Ave
- 50 Clifford St
- 5 Whiting St
- 5 Whiting St Unit 1
- 5 Whiting St Unit 2
- 5 Whiting St
- 11 Whiting St
- 204 Warren St
- 204 Warren St Unit 204
- 204 Warren St Unit 1
- 204 Warren St Unit 4
- 204 Warren St Unit 3
- 204 Warren St Unit 2
- 204 Warren St
- 17 Whiting St
- 210 Warren St
- 210 Warren St Unit 210
- 210 Warren St Unit 2
- 210 Warren St Unit 3
- 210 Warren St Unit 1
- 4 Montrose St
- 4 Montrose St Unit 4
Your Personal Tour Guide
Ask me questions while you tour the home.