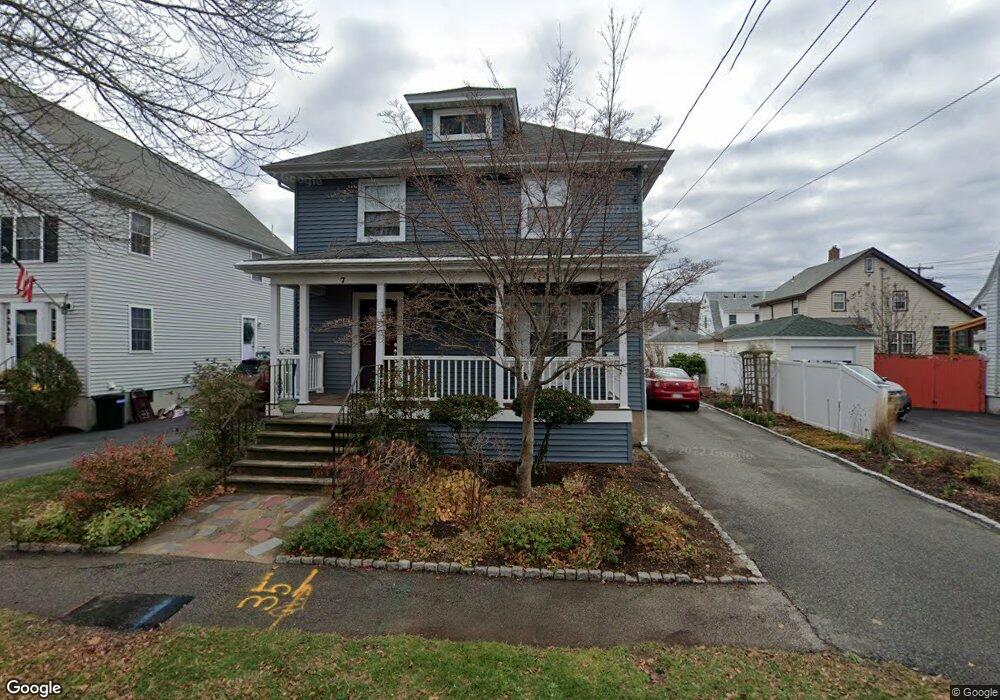
7 Williams St Quincy, MA 02171
Estimated Value: $762,000 - $1,067,000
3
Beds
3
Baths
2,179
Sq Ft
$419/Sq Ft
Est. Value
About This Home
This home is located at 7 Williams St, Quincy, MA 02171 and is currently estimated at $913,216, approximately $419 per square foot. 7 Williams St is a home located in Norfolk County with nearby schools including Squantum Elementary School, Atlantic Middle School, and North Quincy High School.
Ownership History
Date
Name
Owned For
Owner Type
Purchase Details
Closed on
Jun 26, 1995
Sold by
Satkewich Charles P
Bought by
Dindsal Joyce
Current Estimated Value
Home Financials for this Owner
Home Financials are based on the most recent Mortgage that was taken out on this home.
Original Mortgage
$118,400
Interest Rate
7.61%
Create a Home Valuation Report for This Property
The Home Valuation Report is an in-depth analysis detailing your home's value as well as a comparison with similar homes in the area
Home Values in the Area
Average Home Value in this Area
Purchase History
| Date | Buyer | Sale Price | Title Company |
|---|---|---|---|
| Dindsal Joyce | $148,000 | -- |
Source: Public Records
Mortgage History
| Date | Status | Borrower | Loan Amount |
|---|---|---|---|
| Open | Dindsal Joyce | $200,000 | |
| Closed | Dindsal Joyce | $116,000 | |
| Closed | Dindsal Joyce | $118,400 | |
| Closed | Dindsal Joyce | $118,400 |
Source: Public Records
Tax History Compared to Growth
Tax History
| Year | Tax Paid | Tax Assessment Tax Assessment Total Assessment is a certain percentage of the fair market value that is determined by local assessors to be the total taxable value of land and additions on the property. | Land | Improvement |
|---|---|---|---|---|
| 2025 | $9,151 | $793,700 | $366,000 | $427,700 |
| 2024 | $8,832 | $783,700 | $366,000 | $417,700 |
| 2023 | $7,888 | $708,700 | $332,800 | $375,900 |
| 2022 | $7,504 | $626,400 | $266,200 | $360,200 |
| 2021 | $7,441 | $612,900 | $266,200 | $346,700 |
| 2020 | $7,286 | $586,200 | $261,000 | $325,200 |
| 2019 | $7,038 | $560,800 | $251,000 | $309,800 |
| 2018 | $7,002 | $524,900 | $239,000 | $285,900 |
| 2017 | $6,744 | $475,900 | $217,300 | $258,600 |
| 2016 | $6,275 | $437,000 | $197,500 | $239,500 |
| 2015 | $5,822 | $398,800 | $179,600 | $219,200 |
| 2014 | $5,723 | $385,100 | $179,600 | $205,500 |
Source: Public Records
Map
Nearby Homes
- 25 Hummock Rd
- 18 Hummock Rd
- 185 Quincy Shore Dr Unit A28
- 201 Billings St
- 165 Quincy Shore Dr Unit C63
- 148 Quincy Shore Dr Unit 30
- 77 Botolph St
- 158 Quincy Shore Dr Unit 78
- 94 Newbury Ave Unit 100
- 90 Shore Ave
- 90 Quincy Shore Dr Unit 501
- 90 Quincy Shore Dr Unit 701
- 1 Edwin St Unit C
- 57 Quincy Shore Dr Unit 614
- 57 Quincy Shore Dr Unit PH South
- 133 Commander Shea Blvd Unit 219
- 133 Commander Shea Blvd Unit 506
- 133 Commander Shea Blvd Unit 215
- 133 Commander Shea Blvd Unit 315
- 150 Hancock St Unit 102
- 3 Williams St
- 307 E Squantum St
- 15 Williams St
- 10 Ocean St
- 14 Ocean St
- 4 Ocean St
- 18 Ocean St
- 14 Williams St Unit 1
- 14 Williams St
- 21 Williams St
- 312 E Squantum St
- 323 E Squantum St
- 20 Williams St
- 22 Ocean St
- 42 Windsor Rd
- 42 Windsor Rd Unit 42
- 42 Windsor Rd Unit 1
- 37 Edgeworth Rd
- 37 Edgeworth Rd Unit 2
- 22 Williams St