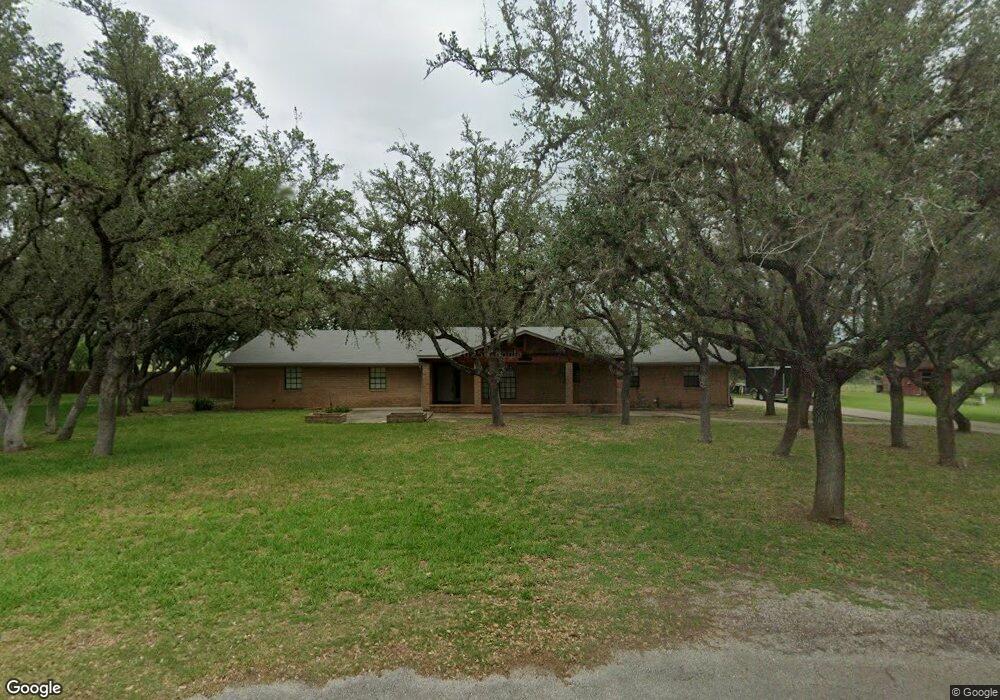
7 Windridge Dr Beeville, TX 78102
Estimated Value: $280,000 - $358,000
3
Beds
2
Baths
2,060
Sq Ft
$159/Sq Ft
Est. Value
About This Home
This home is located at 7 Windridge Dr, Beeville, TX 78102 and is currently estimated at $327,675, approximately $159 per square foot. 7 Windridge Dr is a home located in Bee County with nearby schools including A.C. Jones High School, St. Mary's Academy Charter School, and St. Philip's Episcopal School.
Ownership History
Date
Name
Owned For
Owner Type
Purchase Details
Closed on
Oct 27, 2023
Sold by
Tindol Garrett and Tindol Tiffany
Bought by
Soliz Madison Audrey Stone and Soliz Clarissa Ann
Current Estimated Value
Home Financials for this Owner
Home Financials are based on the most recent Mortgage that was taken out on this home.
Original Mortgage
$325,986
Outstanding Balance
$319,942
Interest Rate
7.18%
Mortgage Type
FHA
Estimated Equity
$7,733
Purchase Details
Closed on
Aug 12, 2015
Sold by
Thomas Ronald E and Thomas Linda S
Bought by
Tindol Garrett E and Tindol Tiffany A
Purchase Details
Closed on
Jul 29, 2010
Sold by
Juve Darrel C and Juve Eugenie K
Bought by
Thomas Ronald E and Thomas Linda S
Home Financials for this Owner
Home Financials are based on the most recent Mortgage that was taken out on this home.
Original Mortgage
$192,240
Interest Rate
4.76%
Mortgage Type
New Conventional
Create a Home Valuation Report for This Property
The Home Valuation Report is an in-depth analysis detailing your home's value as well as a comparison with similar homes in the area
Purchase History
| Date | Buyer | Sale Price | Title Company |
|---|---|---|---|
| Soliz Madison Audrey Stone | -- | Southwest Land Title | |
| Tindol Garrett E | -- | Bee County Title | |
| Thomas Ronald E | -- | None Available |
Source: Public Records
Mortgage History
| Date | Status | Borrower | Loan Amount |
|---|---|---|---|
| Open | Soliz Madison Audrey Stone | $325,986 | |
| Previous Owner | Thomas Ronald E | $192,240 |
Source: Public Records
Tax History
| Year | Tax Paid | Tax Assessment Tax Assessment Total Assessment is a certain percentage of the fair market value that is determined by local assessors to be the total taxable value of land and additions on the property. | Land | Improvement |
|---|---|---|---|---|
| 2025 | $4,027 | $339,440 | $9,760 | $329,680 |
| 2024 | $5,705 | $338,830 | $9,150 | $329,680 |
| 2023 | $5,152 | $315,210 | $6,100 | $309,110 |
| 2022 | $5,977 | $313,380 | $4,270 | $309,110 |
| 2021 | $5,245 | $253,660 | $4,270 | $249,390 |
| 2020 | $5,209 | $250,820 | $4,500 | $246,320 |
| 2019 | $5,231 | $250,820 | $4,500 | $246,320 |
| 2018 | -- | $216,970 | $4,500 | $212,470 |
| 2017 | $4,177 | $216,970 | $4,500 | $212,470 |
| 2016 | $3,936 | $204,460 | $4,500 | $199,960 |
| 2015 | -- | $216,920 | $4,500 | $212,420 |
| 2014 | -- | $201,220 | $4,500 | $196,720 |
Source: Public Records
Map
Nearby Homes
- LOT 3 Fm 351 & Rr
- 00 Farm To Market 673
- 806 W Bates St
- 808 W Bates St
- 0000 Airport
- 000 Airport Rd
- 0000 W Inez St
- 1711 N Washington St
- TBD W Randall St
- 607 W Randall St
- LOT 4 Fm 351 & Rr
- LOT 1 Fm 351 & Rr
- 1701 North Ave E
- 0 Farm To Market Road 351
- 8439 Farm To Market 673
- 307 W Huntington St
- 1804 N Mckinley St
- 1900 Viggo Rd
- 1506 North Ave E
- 705 W Hutchinson St
- 8 Windridge Dr
- 9 Windridge Dr
- 24 Windridge Dr
- 10 Windridge Dr
- 25 Windridge Dr
- 5 Windridge Dr
- 23 Windridge Dr
- 11 Windridge Dr
- 22 Windridge Dr
- 12 Windridge Dr
- 4 Windridge Dr
- 20 Windridge Dr
- 21 Windridge Dr
- 13 Windridge Dr
- 3 Windridge Dr
- 14 Windridge Dr
- 576 W Fm 351
- 18 Windridge Dr
- 2 Windridge Dr
- 15 Windridge Dr
Your Personal Tour Guide
Ask me questions while you tour the home.