NOT LISTED FOR SALE

7 Windsor Place Mebane, NC 27302

Estimated Value: $352,000 - $462,000

4 Beds
3 Baths
2,136 Sq Ft
$188/Sq Ft Est. Value

Last Sold September 28, 2018

Last sale price $210,000 $98 Per Sq Ft

Est. 92% increase in value since last sale

Current estimated payment $2,343/month

About This Home

As of September 2018

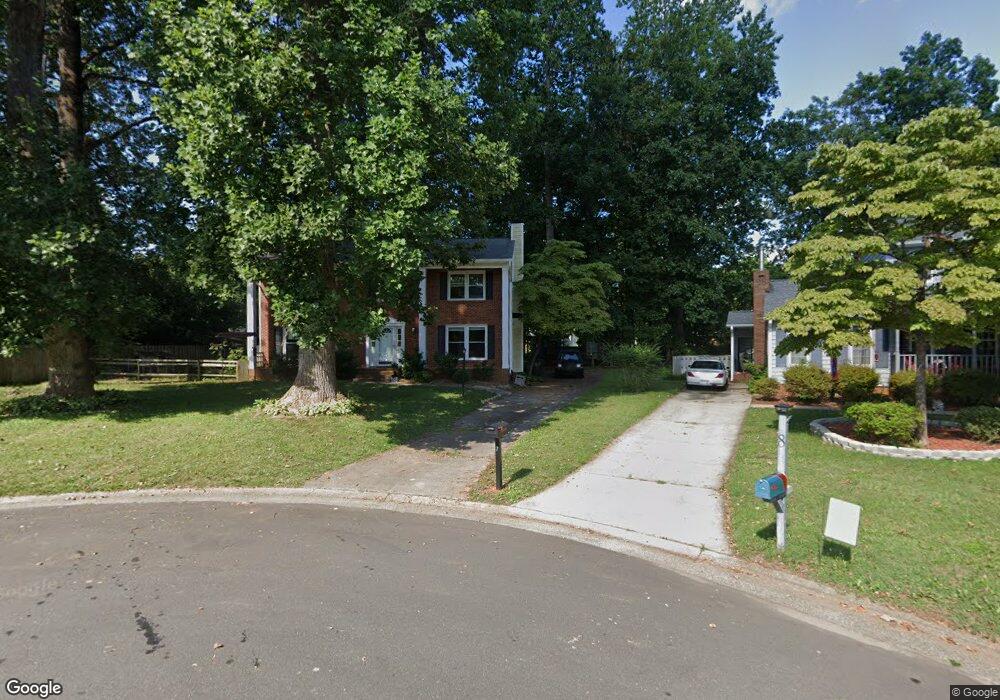
View This Lovely Southern Colonial Home In Desirable Brookhollow S/D In Mebane. Fresh Paint & Flooring Make This House Move-In-Ready! Many Amenities Include Fenced Rear Yard, Large Deck, Stg Bldg, Crown Molding Through Out, 2" Blinds, Lrg Foyer, Spacious Br's, Den W/Fp, Eat-In-Kit, W/D Main Level Conveys, All Appliances, Mbr-2 Closets. Very Convenient To All Amenities In Mebane & I-40/85.

Ownership History

Date Name Owned For Owner Type

Purchase Details

Listed on
May 29, 2018
Closed on
Sep 28, 2018
Sold by
Ford James W
Bought by
Phillips Steven Chad and Phillips Jennifer Childeers
Seller's Agent
Mickey Tripp
Re/MaxDiamond Realty
List Price
$209,900
Sold Price
$210,000
Premium/Discount to List
$100
0.05%
Current Estimated Value
$402,346

Home Financials for this Owner

Home Financials are based on the most recent Mortgage that was taken out on this home.
Estimated Appreciation
$192,346
Avg. Annual Appreciation
9.62%
Original Mortgage
$210,000
Outstanding Balance
$183,132
Interest Rate
4.5%
Mortgage Type
Adjustable Rate Mortgage/ARM
Estimated Equity
$219,214
Source: Public Records

Range of Values:

Collateral Analytics

Collateral Analytics Collateral Analytics AVMs (Automated Valuation Model) employ a number of statistical approaches combined with neighborhood-specific comparable selection guarantees the most up-to-date and precise valuations.

Not Available

Collateral Analytics does not have data for the current month. Please view the chart for historical values.

ICE

ICE Mortgage Technology ICE Mortgage Technology’s AVM (Automated Valuation Model) is a state-of-the-art online residential property valuation tool that provides a quick and accurate estimate of the value of almost any home in the U.S.

Not Available

ICE Mortgage Technology does not have data for the current month. Please view the chart for historical values.

First American

First American First American Data & Analytics’ next-generation AVM combines unrivaled data assets with a blended ensemble of valuation models to produce highly accurate, reliable valuations you can trust.

Not Available

First American does not have data for the current month. Please view the chart for historical values.

Quantarium

Quantarium Quantarium’s valuation service, repeatedly proven the industry’s most accurate and comprehensive, is supercharged with a self-learning and auto-tuning AI engine that continually becomes smarter and more accurate as it processes daily inputs from the industry’s leading RE data lake.

Not Available

Quantarium does not have data for the current month. Please view the chart for historical values.

Average Value
Not Available
List Price
Sold Price
Create a Home Valuation Report for This Property
The Home Valuation Report is an in-depth analysis detailing your home's value as well as a comparison with similar homes in the area

Home Values in the Area

Source: Public Records

Average Home Value in this Area


Source: Public Records

Purchase History

Date Buyer Sale Price Title Company
Phillips Steven Chad $210,000 Attorney
Source: Public Records

Mortgage History

Date Status Borrower Loan Amount
Open Phillips Steven Chad $210,000
Source: Public Records

Property History

Date Event Price List to Sale Price per Sq Ft Prior Sale
09/28/2018 09/28/18 Sold $210,000 0.0% $98 / Sq Ft View Prior Sale
08/29/2018 08/29/18 Pending -- -- --
05/29/2018 05/29/18 For Sale $209,900 -- $98 / Sq Ft

Tax History Compared to Growth

Source: Public Records

Tax History

Year Tax Paid Tax Assessment Tax Assessment Total Assessment is a certain percentage of the fair market value that is determined by local assessors to be the total taxable value of land and additions on the property. Land Improvement
2025 $2,791 $323,088 $55,000 $268,088
2024 $2,711 $323,088 $55,000 $268,088
2023 $2,578 $323,088 $55,000 $268,088
2022 $2,067 $185,485 $40,000 $145,485
2021 $2,086 $185,485 $40,000 $145,485
2020 $2,104 $185,485 $40,000 $145,485
2019 $2,115 $185,485 $40,000 $145,485
2018 $0 $185,485 $40,000 $145,485
2017 $1,938 $185,485 $40,000 $145,485
2016 $1,959 $183,061 $30,000 $153,061
2015 $1,056 $183,061 $30,000 $153,061
2014 $965 $183,061 $30,000 $153,061
Source: Public Records

Agents Affiliated with this Home

  • Section Image
See All Agents

Map