
Seller's Agent in 2019
Ben Faubert
Onshore Realtors
(401) 315-2588
109 Total Sales


Estimated Value: $593,000 - $626,000
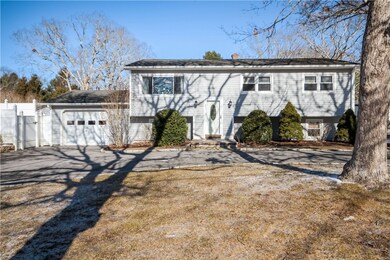
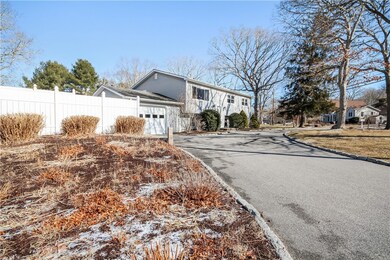
This home is located at 7 Wompag Rd, Westerly, RI 02891 since 22 February 2019 and is currently estimated at $614,250, approximately $307 per square foot. This property was built in 1974. 7 Wompag Rd is a home located in Washington County with nearby schools including Westerly High School.
Last Agent to Sell the Property
Onshore Realtors License #REC.0017150 Listed on: 02/22/2019
We collect this data history from publicly available records. To have your information removed, we recommend requesting removal directly through your county’s website.
We collect this data history from publicly available records. To have your information removed, we recommend requesting removal directly through your county’s website.
| Date | Buyer | Sale Price | Title Company |
|---|---|---|---|
| $329,000 | -- | ||
| $295,000 | -- | ||
| $137,000 | -- |
We collect this data history from publicly available records. To have your information removed, we recommend requesting removal directly through your county’s website.
| Date | Status | Borrower | Loan Amount |
|---|---|---|---|
| Open | $325,701 | ||
| Closed | $329,000 | ||
| Previous Owner | $236,000 | ||
| Previous Owner | $241,000 | ||
| Previous Owner | $20,000 | ||
| Previous Owner | $244,000 | ||
| Previous Owner | $219,000 | ||
| Previous Owner | $25,000 | ||
| Previous Owner | $197,600 | ||
| Previous Owner | $162,200 | ||
| Previous Owner | $80,500 | ||
| Previous Owner | $65,000 |
We collect this data history from publicly available records. To have your information removed, we recommend requesting removal directly through your county’s website.
| Date | Event | Price | List to Sale | Price per Sq Ft | Prior Sale |
|---|---|---|---|---|---|
| 04/12/2019 04/12/19 | Sold | $329,000 | -0.2% | $165 / Sq Ft | |
| 03/13/2019 03/13/19 | Pending | -- | -- | -- | |
| 02/22/2019 02/22/19 | For Sale | $329,500 | +11.7% | $165 / Sq Ft | |
| 02/28/2017 02/28/17 | Sold | $295,000 | -1.6% | $148 / Sq Ft | View Prior Sale |
| 02/27/2017 02/27/17 | For Sale | $299,900 | -- | $150 / Sq Ft |
We collect this data history from publicly available records. To have your information removed, we recommend requesting removal directly through your county’s website.
| Year | Tax Paid | Tax Assessment Tax Assessment Total Assessment is a certain percentage of the fair market value that is determined by local assessors to be the total taxable value of land and additions on the property. | Land | Improvement |
|---|---|---|---|---|
| 2025 | $3,373 | $474,400 | $186,100 | $288,300 |
| 2024 | $3,647 | $371,800 | $132,900 | $238,900 |
| 2023 | $3,577 | $371,800 | $132,900 | $238,900 |
| 2022 | $3,554 | $371,800 | $132,900 | $238,900 |
| 2021 | $3,466 | $300,900 | $115,500 | $185,400 |
| 2020 | $3,403 | $300,900 | $115,500 | $185,400 |
| 2019 | $3,370 | $300,900 | $115,500 | $185,400 |
| 2018 | $3,122 | $262,800 | $115,500 | $147,300 |
| 2017 | $3,046 | $262,800 | $115,500 | $147,300 |
| 2016 | $3,070 | $262,800 | $115,500 | $147,300 |
| 2015 | $2,861 | $264,400 | $123,600 | $140,800 |
| 2014 | $2,813 | $264,400 | $123,600 | $140,800 |
Seller's Agent in 2019
Ben Faubert
Onshore Realtors
(401) 315-2588
109 Total Sales
Buyer's Agent in 2019
Peter Spinella
Century 21 Guardian Realty
(401) 515-5531
81 Total Sales
Source: State-Wide MLS
MLS Number: 1215690
APN: WEST-000123-000033
Disclaimer: Certain information contained herein is derived from information provided by parties other than Homes.com. All information provided is deemed reliable, but is not guaranteed to be accurate and should be independently verified.
![]() IDX information is provided exclusively for personal, non-commercial use, and may not be used for any purpose other than to identify prospective properties consumers may be interested in purchasing. Information is deemed reliable but not guaranteed.
IDX information is provided exclusively for personal, non-commercial use, and may not be used for any purpose other than to identify prospective properties consumers may be interested in purchasing. Information is deemed reliable but not guaranteed.
Copyright © 2026 State-Wide MLS, Inc. All rights reserved.
Ask me questions while you tour the home.