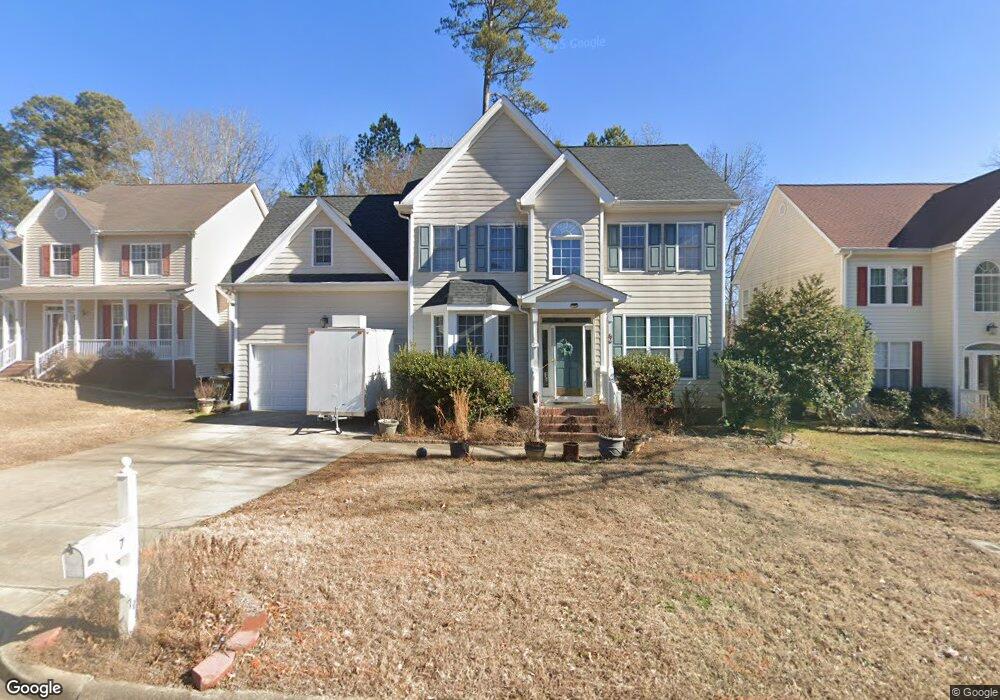
7 Woodsage Ln Durham, NC 27713
Estimated Value: $487,060 - $507,000
4
Beds
3
Baths
2,053
Sq Ft
$244/Sq Ft
Est. Value
About This Home
This home is located at 7 Woodsage Ln, Durham, NC 27713 and is currently estimated at $500,015, approximately $243 per square foot. 7 Woodsage Ln is a home located in Durham County with nearby schools including Parkwood Elementary, Centerville Junior High School, and Lowe's Grove Middle.
Ownership History
Date
Name
Owned For
Owner Type
Purchase Details
Closed on
Aug 2, 2018
Sold by
Minion Brian K and Minion Lenora
Bought by
Ahmad Iqbal and Ahmad Nazli
Current Estimated Value
Home Financials for this Owner
Home Financials are based on the most recent Mortgage that was taken out on this home.
Original Mortgage
$213,750
Outstanding Balance
$185,633
Interest Rate
4.5%
Mortgage Type
Purchase Money Mortgage
Estimated Equity
$314,382
Purchase Details
Closed on
Mar 29, 2007
Sold by
Fader Robert A and Fader Wendy O
Bought by
Minion Brian K
Home Financials for this Owner
Home Financials are based on the most recent Mortgage that was taken out on this home.
Original Mortgage
$129,900
Interest Rate
6.27%
Mortgage Type
Purchase Money Mortgage
Purchase Details
Closed on
Jun 29, 2000
Sold by
F & L Developers Inc
Bought by
Fader Robert A and Fader Wendy O
Home Financials for this Owner
Home Financials are based on the most recent Mortgage that was taken out on this home.
Original Mortgage
$139,750
Interest Rate
8.63%
Create a Home Valuation Report for This Property
The Home Valuation Report is an in-depth analysis detailing your home's value as well as a comparison with similar homes in the area
Home Values in the Area
Average Home Value in this Area
Purchase History
| Date | Buyer | Sale Price | Title Company |
|---|---|---|---|
| Ahmad Iqbal | $285,000 | None Available | |
| Minion Brian K | $230,000 | None Available | |
| Fader Robert A | $185,000 | -- |
Source: Public Records
Mortgage History
| Date | Status | Borrower | Loan Amount |
|---|---|---|---|
| Open | Ahmad Iqbal | $213,750 | |
| Previous Owner | Minion Brian K | $129,900 | |
| Previous Owner | Fader Robert A | $139,750 |
Source: Public Records
Tax History Compared to Growth
Tax History
| Year | Tax Paid | Tax Assessment Tax Assessment Total Assessment is a certain percentage of the fair market value that is determined by local assessors to be the total taxable value of land and additions on the property. | Land | Improvement |
|---|---|---|---|---|
| 2025 | $4,543 | $458,255 | $120,000 | $338,255 |
| 2024 | $3,734 | $267,662 | $60,000 | $207,662 |
| 2023 | $3,506 | $267,662 | $60,000 | $207,662 |
| 2022 | $3,426 | $267,662 | $60,000 | $207,662 |
| 2021 | $3,410 | $267,662 | $60,000 | $207,662 |
| 2020 | $3,329 | $267,662 | $60,000 | $207,662 |
| 2019 | $3,329 | $267,662 | $60,000 | $207,662 |
| 2018 | $3,097 | $228,314 | $36,000 | $192,314 |
| 2017 | $3,074 | $228,314 | $36,000 | $192,314 |
| 2016 | $2,971 | $228,314 | $36,000 | $192,314 |
| 2015 | $2,936 | $212,107 | $39,204 | $172,903 |
| 2014 | $2,936 | $212,107 | $39,204 | $172,903 |
Source: Public Records
Map
Nearby Homes
- 1510 Haventree Rd
- 104 Deblyn Ct
- 1445 Sedwick Rd
- 5320 Newhall Rd
- 704 Colby Place
- 5504 Pelham Rd
- 6353 Grandale Dr
- 12 Stonehouse Ct
- 1621 Clermont Rd
- 5916 Lyon Farm Dr
- 1304 Seaton Rd Unit 1
- 1304 Seaton Rd Unit 17
- 1304 Seaton Rd Unit 24
- 1227 Seaton Rd Unit 54
- 1728 Euclid Rd
- 109 Settlers Mill Ln
- 27 Sunflower Ct
- 1018 Fenwick Pkwy
- 8018 Rosemont Pkwy
- 7409 Chesley Ln
- 5 Woodsage Ln
- 9 Woodsage Ln
- 5930 Rustic Wood Ln
- 3 Woodsage Ln
- 5926 Rustic Wood Ln
- 8 Woodsage Ln
- 10 Woodsage Ln
- 6 Woodsage Ln
- 1 Woodsage Ln
- 1305 Haventree Rd
- 5924 Rustic Wood Ln
- 4 Woodsage Ln
- 1403 Haventree Rd
- 1408 Haventree Rd
- 1405 Haventree Rd
- 5920 Rustic Wood Ln
- 8 Monarch Way
- 5927 Rustic Wood Ln
- 9 Silverwood Ct
- 5931 Rustic Wood Ln