T
Seller's Agent in 2022
Timothy Nguyen
Keller Williams Realty
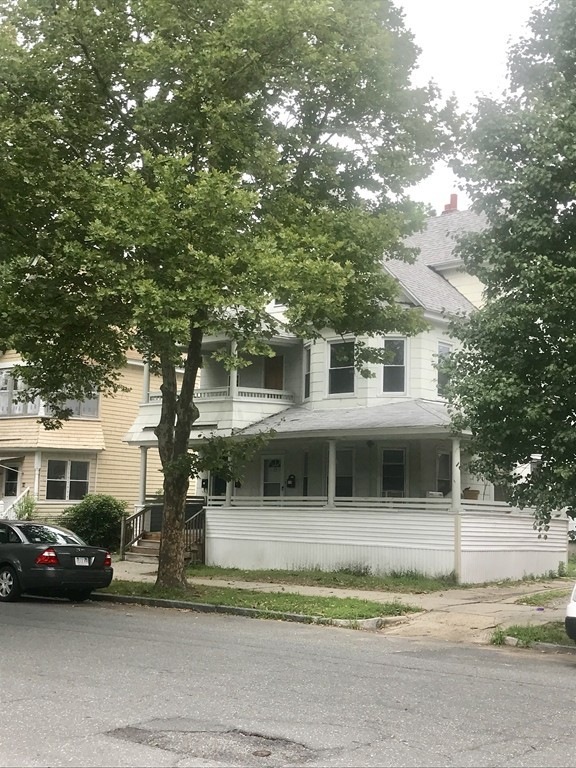
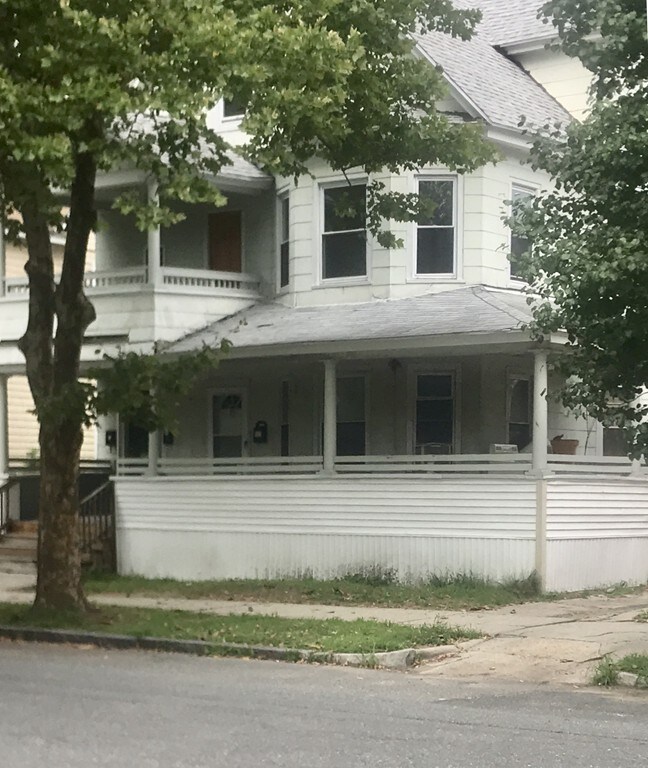
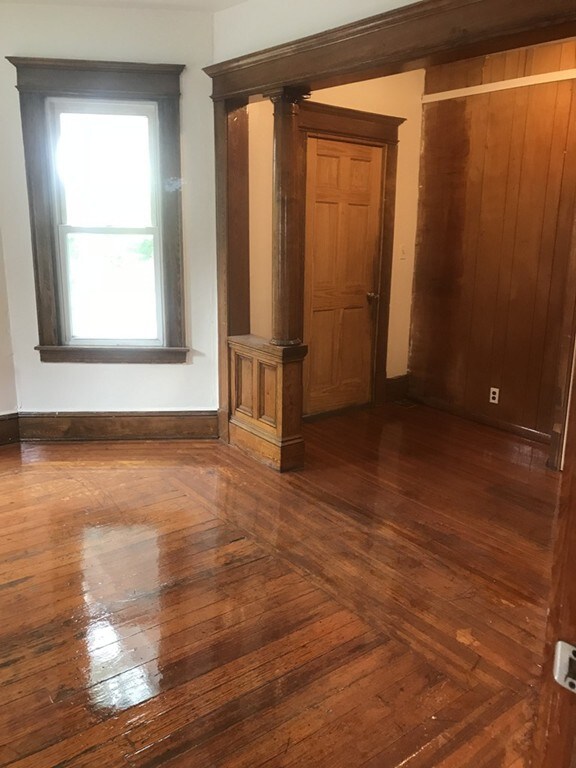
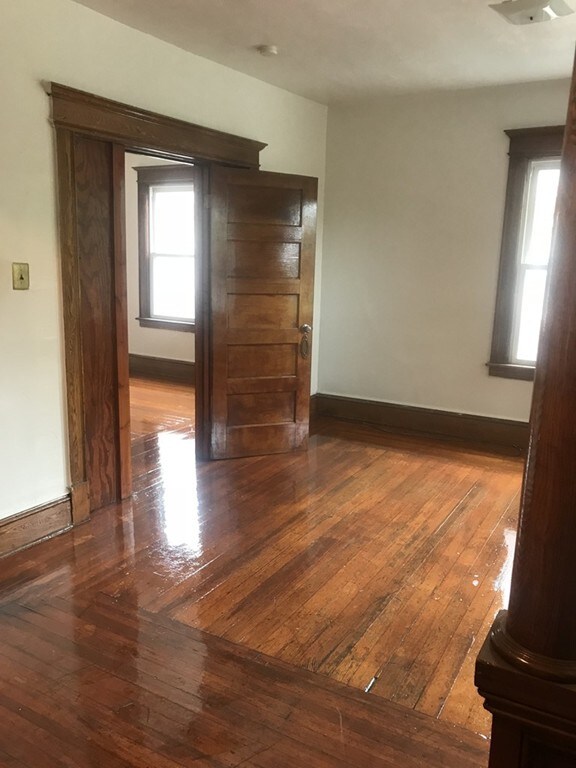
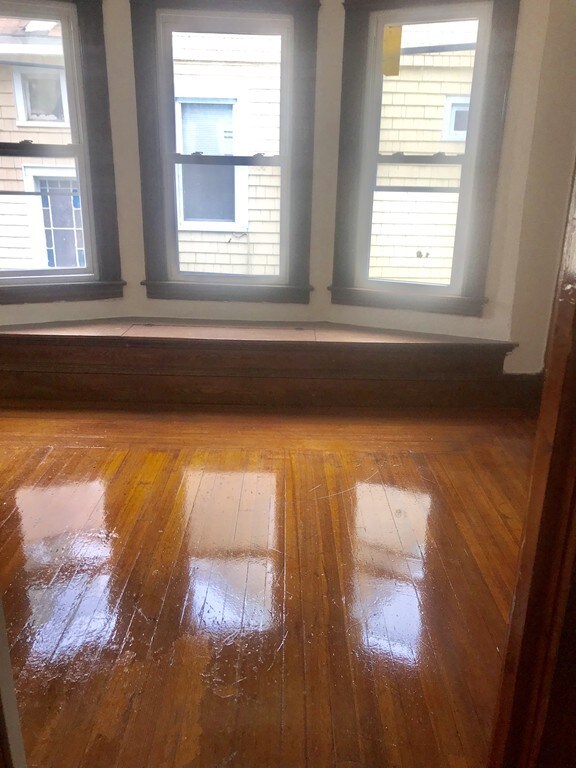
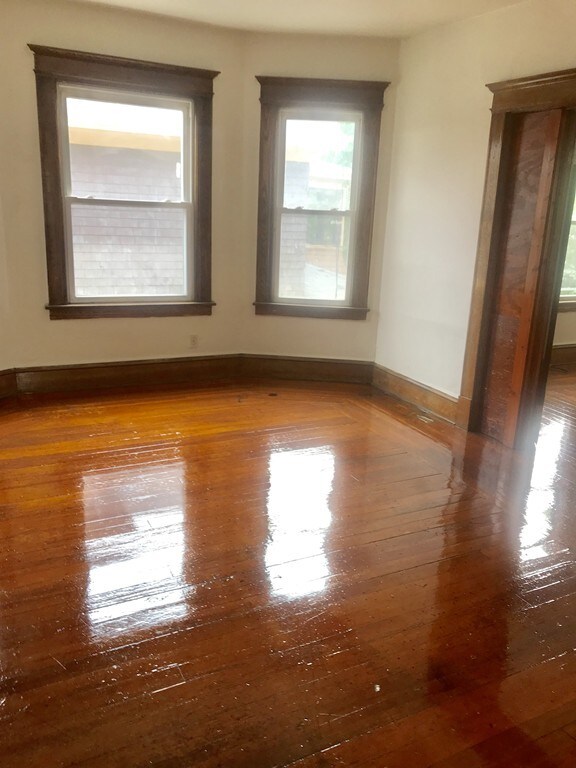
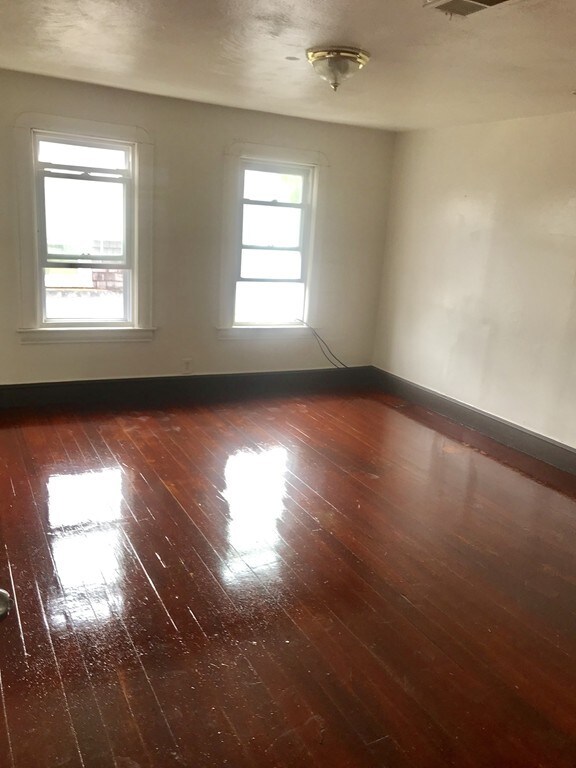
Investors take notice! Certified lead treated 3 family home has been well maintained with de-leading certificates in hand and centrally located to all amenities. Recent major improvements include a new roof (2017), new vinyl siding surrounding 1st floor porch (2018) and 2nd and 3rd floors were just painted and floors sanded and polished to high shine (2018), 2nd floor high efficiency heating system installed in 2016 (APO) and newer heating systems for 1st & 3rd floors within last 5 yrs (APO). First floor unit features 3 bedrooms, full bath, eat in kitchen with pantry, and a comfortable living room and huge wrap around front porch. Second floor has the same layout but could be used together with the 3rd floor for a large family with 5 bedroom and 2 full baths and has large front and back porches. Or.... leave the 3rd floor as separate unit with 2 bedroom, eat-in kitchen and bath. This house has so much potential with 2 or 3 units rented at market value, it could be your cash cow!
Last Buyer's Agent
Timothy Nguyen
Keller Williams Realty

| Date | Type | Sale Price | Title Company |
|---|---|---|---|
| Quit Claim Deed | -- | None Available | |
| Quit Claim Deed | -- | None Available | |
| Quit Claim Deed | -- | None Available | |
| Quit Claim Deed | -- | None Available | |
| Quit Claim Deed | -- | None Available | |
| Quit Claim Deed | -- | None Available | |
| Deed | $90,000 | -- | |
| Deed | $90,000 | -- | |
| Deed | $98,500 | -- | |
| Deed | $98,500 | -- | |
| Foreclosure Deed | $90,343 | -- | |
| Foreclosure Deed | $90,343 | -- | |
| Deed | $90,000 | -- | |
| Deed | $51,000 | -- | |
| Deed | $51,000 | -- | |
| Foreclosure Deed | $46,800 | -- | |
| Foreclosure Deed | $46,800 | -- | |
| Deed | $85,000 | -- | |
| Deed | $85,000 | -- | |
| Deed | $34,233 | -- | |
| Deed | $34,233 | -- | |
| Foreclosure Deed | $35,000 | -- | |
| Foreclosure Deed | $35,000 | -- |
| Date | Status | Loan Amount | Loan Type |
|---|---|---|---|
| Open | $570,000 | Commercial | |
| Closed | $570,000 | Commercial | |
| Previous Owner | $240,000 | Stand Alone Refi Refinance Of Original Loan | |
| Previous Owner | $140,600 | New Conventional |
| Date | Event | Price | Change | Sq Ft Price |
|---|---|---|---|---|
| 02/11/2022 02/11/22 | Sold | $190,000 | +2.7% | $57 / Sq Ft |
| 01/18/2022 01/18/22 | Pending | -- | -- | -- |
| 01/17/2022 01/17/22 | For Sale | $185,000 | +25.0% | $56 / Sq Ft |
| 09/28/2018 09/28/18 | Sold | $148,000 | +5.8% | $45 / Sq Ft |
| 07/24/2018 07/24/18 | Pending | -- | -- | -- |
| 07/17/2018 07/17/18 | For Sale | $139,900 | -- | $42 / Sq Ft |
| Year | Tax Paid | Tax Assessment Tax Assessment Total Assessment is a certain percentage of the fair market value that is determined by local assessors to be the total taxable value of land and additions on the property. | Land | Improvement |
|---|---|---|---|---|
| 2025 | $5,234 | $333,800 | $30,000 | $303,800 |
| 2024 | $5,003 | $311,500 | $30,000 | $281,500 |
| 2023 | $4,339 | $254,500 | $27,300 | $227,200 |
| 2022 | $3,482 | $185,000 | $25,500 | $159,500 |
| 2021 | $3,368 | $178,200 | $23,200 | $155,000 |
| 2020 | $2,781 | $142,400 | $23,200 | $119,200 |
| 2019 | $2,728 | $138,600 | $23,200 | $115,400 |
| 2018 | $2,686 | $136,500 | $23,200 | $113,300 |
| 2017 | $2,438 | $124,000 | $21,800 | $102,200 |
| 2016 | $2,194 | $111,600 | $21,800 | $89,800 |
| 2015 | $2,209 | $112,300 | $21,800 | $90,500 |
T
Seller's Agent in 2022
Timothy Nguyen
Keller Williams Realty
Buyer's Agent in 2022
Drew Rodman
Lock and Key Realty Inc.
(413) 386-3558
17 in this area
103 Total Sales
Seller's Agent in 2018
Kristin O Connor
HB Real Estate, LLC
(413) 478-5016
37 Total Sales
Source: MLS Property Information Network (MLS PIN)
MLS Number: 72363823
APN: SPRI-000210-000000-000019
Disclaimer: Certain information contained herein is derived from information provided by parties other than Homes.com. All information provided is deemed reliable, but is not guaranteed to be accurate and should be independently verified.
![]() The property listing data and information, or the Images, set forth herein were provided to MLS Property Information Network, Inc. from third party sources, including sellers, lessors and public records, and were compiled by MLS Property Information Network, Inc. The property listing data and information, and the Images, are for the personal, non-commercial use of consumers having a good faith interest in purchasing or leasing listed properties of the type displayed to them and may not be used for any purpose other than to identify prospective properties which such consumers may have a good faith interest in purchasing or leasing. MLS Property Information Network, Inc. and its subscribers disclaim any and all representations and warranties as to the accuracy of the property listing data and information, or as to the accuracy of any of the Images, set forth herein.
The property listing data and information, or the Images, set forth herein were provided to MLS Property Information Network, Inc. from third party sources, including sellers, lessors and public records, and were compiled by MLS Property Information Network, Inc. The property listing data and information, and the Images, are for the personal, non-commercial use of consumers having a good faith interest in purchasing or leasing listed properties of the type displayed to them and may not be used for any purpose other than to identify prospective properties which such consumers may have a good faith interest in purchasing or leasing. MLS Property Information Network, Inc. and its subscribers disclaim any and all representations and warranties as to the accuracy of the property listing data and information, or as to the accuracy of any of the Images, set forth herein.