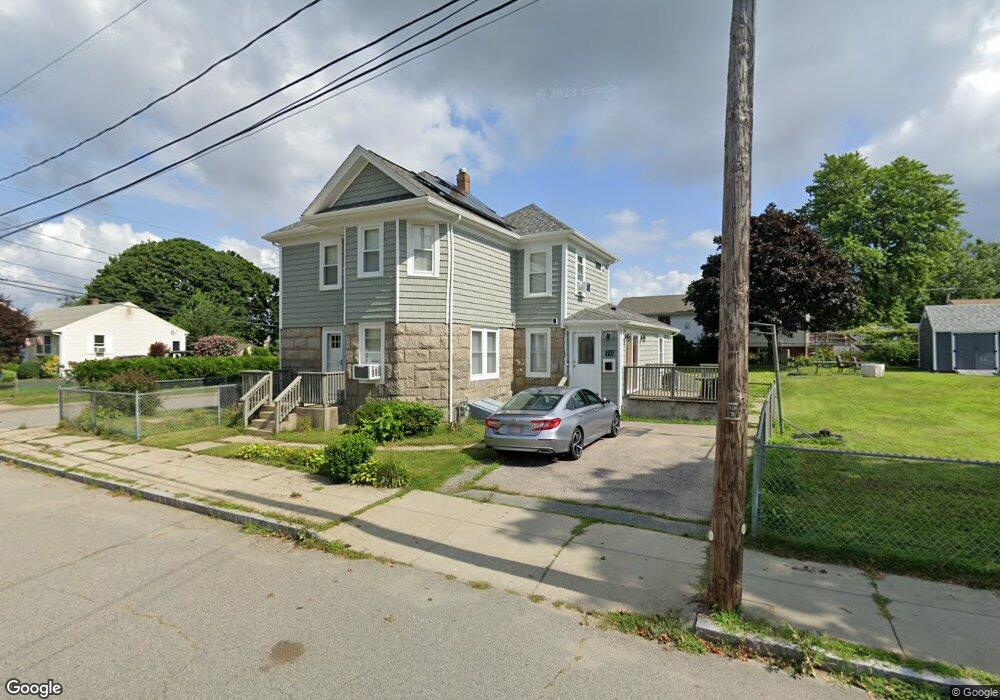
70 Anthony St Fall River, MA 02721
Maplewood NeighborhoodEstimated Value: $484,547 - $618,000
6
Beds
2
Baths
2,310
Sq Ft
$244/Sq Ft
Est. Value
About This Home
This home is located at 70 Anthony St, Fall River, MA 02721 and is currently estimated at $564,137, approximately $244 per square foot. 70 Anthony St is a home located in Bristol County with nearby schools including Letourneau Elementary School, Matthew J. Kuss Middle School, and B M C Durfee High School.
Ownership History
Date
Name
Owned For
Owner Type
Purchase Details
Closed on
Feb 7, 2023
Sold by
Coelho Manuel V and Coelho Alica E
Bought by
Coelho Manuel V and Coelho Alicia E
Current Estimated Value
Purchase Details
Closed on
Sep 30, 1993
Sold by
Gallant Alfred and Gallant Maureen J
Bought by
Coelho Manuel and Coelho Alicia
Create a Home Valuation Report for This Property
The Home Valuation Report is an in-depth analysis detailing your home's value as well as a comparison with similar homes in the area
Home Values in the Area
Average Home Value in this Area
Purchase History
| Date | Buyer | Sale Price | Title Company |
|---|---|---|---|
| Coelho Manuel V | -- | None Available | |
| Coelho Manuel | $132,000 | -- |
Source: Public Records
Mortgage History
| Date | Status | Borrower | Loan Amount |
|---|---|---|---|
| Previous Owner | Coelho Manuel | $176,000 | |
| Previous Owner | Coelho Manuel | $150,000 |
Source: Public Records
Tax History
| Year | Tax Paid | Tax Assessment Tax Assessment Total Assessment is a certain percentage of the fair market value that is determined by local assessors to be the total taxable value of land and additions on the property. | Land | Improvement |
|---|---|---|---|---|
| 2025 | $5,372 | $469,200 | $130,600 | $338,600 |
| 2024 | $4,942 | $430,100 | $125,700 | $304,400 |
| 2023 | $4,421 | $360,300 | $107,700 | $252,600 |
| 2022 | $3,688 | $292,200 | $97,900 | $194,300 |
| 2021 | $3,426 | $247,700 | $90,600 | $157,100 |
| 2020 | $3,075 | $212,800 | $86,700 | $126,100 |
| 2019 | $2,907 | $199,400 | $82,600 | $116,800 |
| 2018 | $2,757 | $188,600 | $81,100 | $107,500 |
| 2017 | $2,582 | $184,400 | $82,700 | $101,700 |
| 2016 | $2,526 | $185,300 | $86,100 | $99,200 |
| 2015 | $2,384 | $182,300 | $83,000 | $99,300 |
| 2014 | $2,457 | $195,300 | $87,300 | $108,000 |
Source: Public Records
Map
Nearby Homes
Your Personal Tour Guide
Ask me questions while you tour the home.