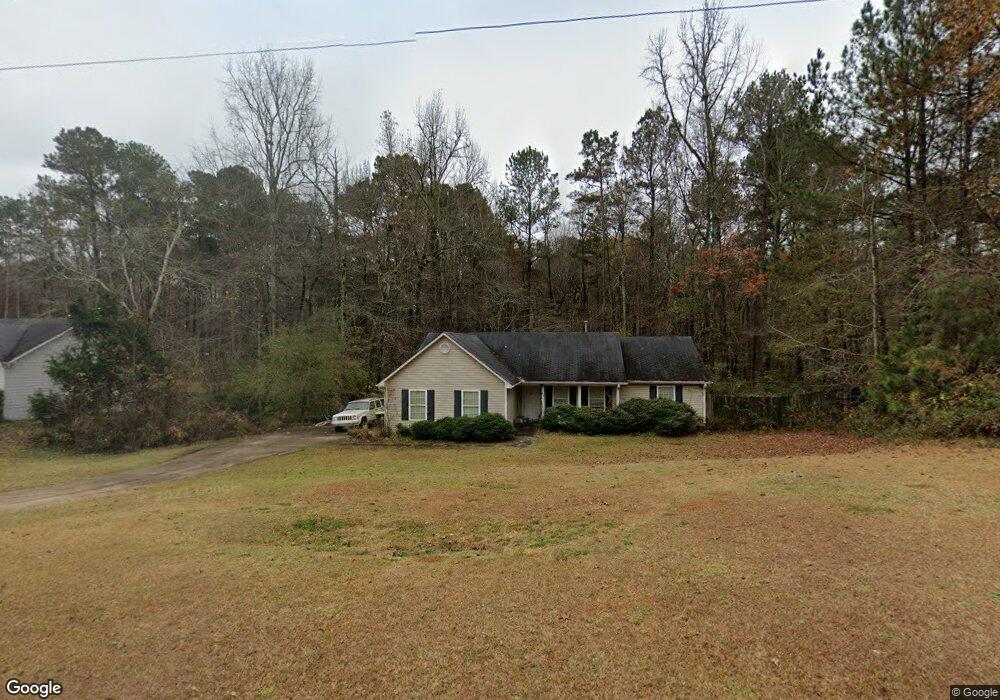
70 Beaver Creek Ln Sharpsburg, GA 30277
Estimated Value: $297,040 - $341,000
3
Beds
3
Baths
1,460
Sq Ft
$218/Sq Ft
Est. Value
About This Home
This home is located at 70 Beaver Creek Ln, Sharpsburg, GA 30277 and is currently estimated at $318,760, approximately $218 per square foot. 70 Beaver Creek Ln is a home located in Coweta County with nearby schools including Willis Road Elementary School, Lee Middle School, and East Coweta High School.
Ownership History
Date
Name
Owned For
Owner Type
Purchase Details
Closed on
May 22, 2009
Sold by
Fitzgerald Wayne C
Bought by
Jones Floyd L and Jones Celeste M
Current Estimated Value
Home Financials for this Owner
Home Financials are based on the most recent Mortgage that was taken out on this home.
Original Mortgage
$117,000
Outstanding Balance
$73,445
Interest Rate
4.81%
Mortgage Type
New Conventional
Estimated Equity
$245,315
Purchase Details
Closed on
Jan 23, 1998
Bought by
Regional Atlanta Dev
Purchase Details
Closed on
May 6, 1997
Sold by
Wallace Gary M
Bought by
Mike Kruse Contractors
Home Financials for this Owner
Home Financials are based on the most recent Mortgage that was taken out on this home.
Original Mortgage
$71,250
Interest Rate
8.2%
Mortgage Type
New Conventional
Purchase Details
Closed on
Sep 7, 1989
Bought by
Wallace Gary M
Create a Home Valuation Report for This Property
The Home Valuation Report is an in-depth analysis detailing your home's value as well as a comparison with similar homes in the area
Home Values in the Area
Average Home Value in this Area
Purchase History
| Date | Buyer | Sale Price | Title Company |
|---|---|---|---|
| Jones Floyd L | $130,000 | -- | |
| Regional Atlanta Dev | $10,000 | -- | |
| Mike Kruse Contractors | $10,000 | -- | |
| Wallace Gary M | -- | -- |
Source: Public Records
Mortgage History
| Date | Status | Borrower | Loan Amount |
|---|---|---|---|
| Open | Jones Floyd L | $117,000 | |
| Previous Owner | Mike Kruse Contractors | $71,250 |
Source: Public Records
Tax History Compared to Growth
Tax History
| Year | Tax Paid | Tax Assessment Tax Assessment Total Assessment is a certain percentage of the fair market value that is determined by local assessors to be the total taxable value of land and additions on the property. | Land | Improvement |
|---|---|---|---|---|
| 2025 | $2,709 | $114,650 | $22,000 | $92,650 |
| 2024 | $2,649 | $114,106 | $22,000 | $92,106 |
| 2023 | $2,649 | $97,348 | $18,000 | $79,348 |
| 2022 | $2,084 | $84,584 | $18,000 | $66,584 |
| 2021 | $1,958 | $74,390 | $18,000 | $56,390 |
| 2020 | $1,971 | $74,390 | $18,000 | $56,390 |
| 2019 | $1,762 | $60,206 | $10,000 | $50,206 |
| 2018 | $1,765 | $60,206 | $10,000 | $50,206 |
| 2017 | $1,704 | $58,128 | $10,000 | $48,128 |
| 2016 | $1,683 | $58,128 | $10,000 | $48,128 |
| 2015 | $1,320 | $46,356 | $10,000 | $36,356 |
| 2014 | $1,162 | $41,162 | $10,000 | $31,162 |
Source: Public Records
Map
Nearby Homes
- 20 Beaver Creek Ln
- 131 Pecan Lake Dr
- 1367 Sharpsburg McCollum Rd
- 0 Highway 154 Unit 10470800
- 270 Sturgess Run
- 150 Riverside Dr
- 45 Riverside Walk
- 5 Riverside Dr
- 65 Ellis Rd
- 11 Masters Way
- 25 Chemin Place
- Camden Plan at Candleberry Place
- Savannah Plan at Candleberry Place
- Briarwood Plan at Candleberry Place
- Newport Plan at Candleberry Place
- 9 Candleberry Way
- 5 Candleberry Way
- 180 Saint James Place
- 75 Olympia Dr
- 25 Lentry Dr
- 0 Beaver Creek Ln Unit 3158595
- 0 Beaver Creek Ln Unit 8617371
- 74 Beaver Creek Ln
- 60 Beaver Creek Ln
- 80 Beaver Creek Ln
- 75 Beaver Creek Ln
- 50 Beaver Creek Ln
- 65 Beaver Creek Ln
- 55 Beaver Creek Ln
- 85 Beaver Creek Ln
- 40 Beaver Creek Ln
- 90 Beaver Creek Ln
- 45 Beaver Creek Ln
- 95 Beaver Creek Ln
- 30 Beaver Creek Ln
- 100 Beaver Creek Ln
- 75 Beaver Creek Dr
- 35 Beaver Creek Ln
- 65 Beaver Creek Dr
- 105 Beaver Creek Ln